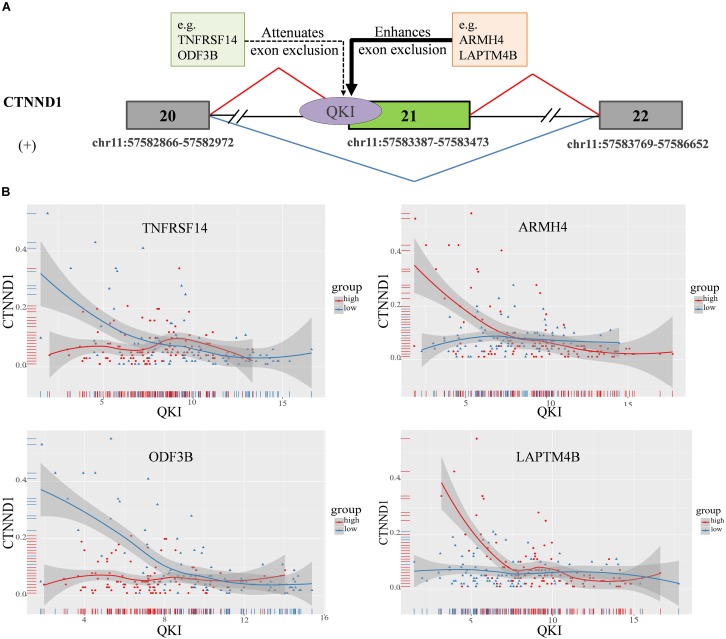
FIGURE 5.
CTNND1 splicing outcomes influenced by modulator expression in KIRC. (A) Examples of modulators in each mode sub-categories, including exon exclusion to inclusion (ExonEI), exon inclusion to exclusion (ExonIE), enhances exon exclusion (EEE) and attenuates exon exclusion (AEE). (B) Four modulators influence splicing outcomes of CTNND1, including TNFRSF14, ARMH4, LAPTM4B, and ODF3B. The red means the samples in modulator expression high group (top 33%), the blue means the samples in modulator expression low group (bottom 33%). The x-axis is the expression level of QKI, y-axis is splicing outcome (PSI value) of CTNND1.

