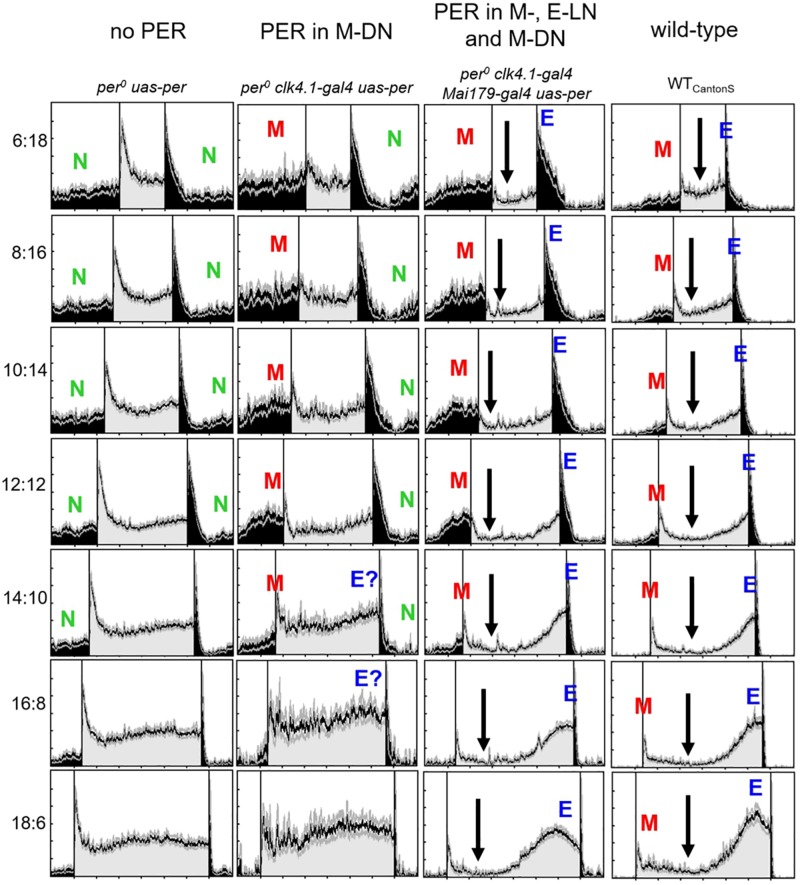
FIGURE 3.
Normalized average activity profiles of 25–30 flies, respectively, of the following lines: (1) per0 mutant controls (no per), (2) flies with per only in ∼8 CRY-positive dorsal posterior neurons (per in DN1p), (3) flies with per in most lateral neurons and in the DN1p (per in M- and E-LNs and DN1p), and (4) wild-type flies (WTCantonS). Labeling as in Figure 1C.

