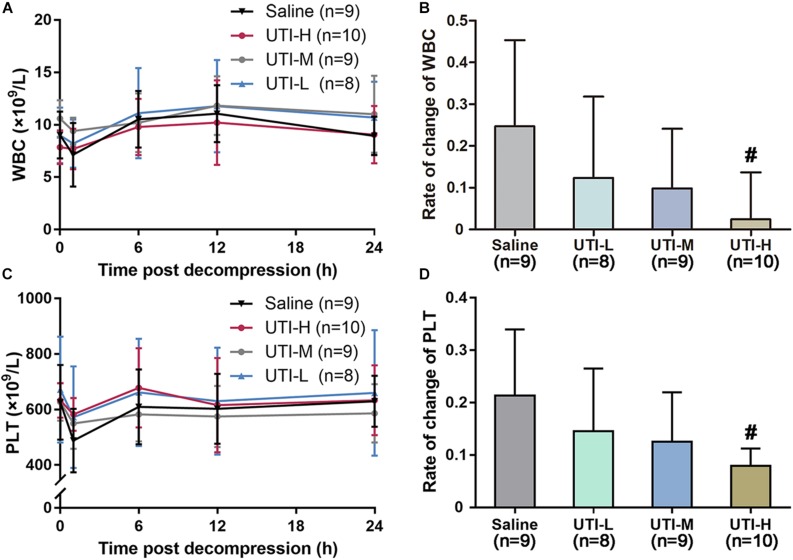
FIGURE 4.
Protective effects of different doses of UTI on blood routine. Blood was sampled from marginal ear veins in rabbits treated with saline or UTI before and after a simulated dive. Changes of WBC and PLT with time are shown (A,C), and respective changes rates of different groups at 1 h following decompression are shown in panels (B,D). The change rates of WBC and PLT were compared between UTI and Saline groups, respectively. #P < 0.01 vs. Saline group.

