
Figure 1.
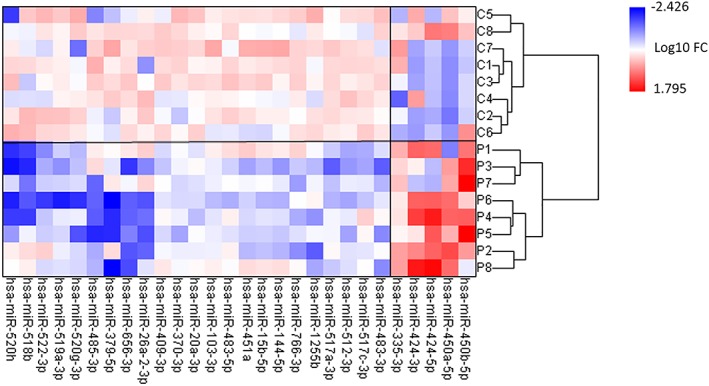
Heatmap showing the 28 microRNAs (miRNAs) found to be differentially expressed in skeletal muscle of non‐small cell lung cancer (NSCLC) patients with cachexia (P, n = 8) in comparison with age‐matched healthy controls (C, n = 8). The expression of miRNAs was measured by TaqMan® Array Human MicroRNA in vastus lateralis muscle biopsies as described in the Methods section. Red: up‐regulated miRNAs; blue: down‐regulated miRNAs. Only those miRNAs with a P < 0.05 and fold change (FC) ≥ 2 are shown (two‐tailed t‐test). The numbers on the legend are log10‐transformed values. Hierarchical cluster analysis of all subjects using Ward's method was conducted, resulting in a separation into cachectic NSCLC patients and healthy controls, respectively.