
Figure 4.
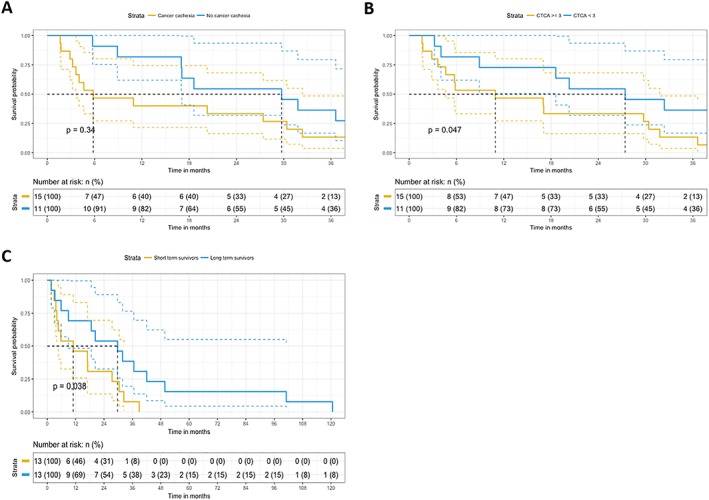
Kaplan–Meier plots for cachexia, treatment‐induced toxicity, and microRNA (miRNA) expression. (A) Kaplan–Meier plot was constructed to assess the survival function of non‐small cell lung cancer (NSCLC) patients with cachexia (n = 15) vs. without cachexia (n = 11). Cachectic NSCLC patients had a shorter overall survival (OS) when compared with non‐cachectic NSCLC patients. The log‐rank P‐value was not significant. (B) Kaplan–Meier plot was constructed to assess the survival function of NSCLC patients with a CTCAE ≥ 3 vs. NSCLC patients with a CTCAE < 3. Patients received either chemotherapy or a combination of chemotherapy and radiotherapy. NSCLC patients with a CTCAE ≥ 3 had a shorter OS compared with NSCLC patients with a CTCAE < 3. The log‐rank P‐value was not significant. (C) Kaplan–Meier plot was constructed to assess the survival function of miRNA expression in NSCLC. Multivariate analysis using the miRNAs with the lowest P‐value and highest hazard ratios (miR‐450a‐5p and miR‐451a) in linear combination yield a significant stratification into two distinct survival groups (short‐term and long‐term survival).