
Figure 1.
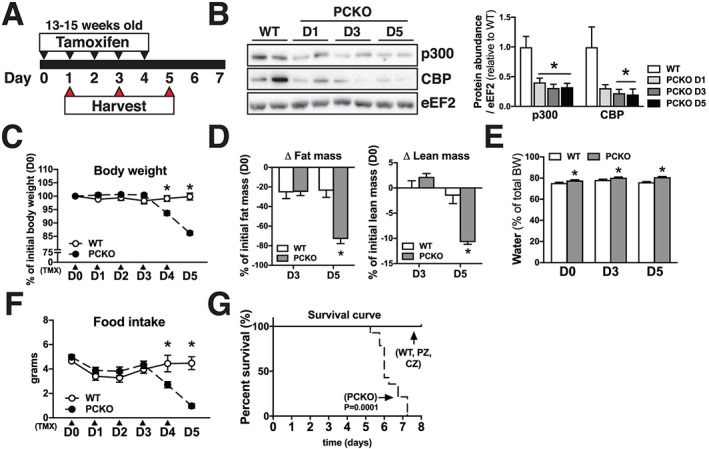
Knockout of p300 and CBP in PCKO mice is lethal. (A) Schematic representation. Tamoxifen (TMX) was administered to the mice via gavage at day 0 (D0) through D4. Tissues were harvested at D1, D3, and D5. (B) Representative blots of p300 and CBP protein abundance in gastrocnemius. Bar graphs represent quantification of p300 and CBP protein abundance in WT and PCKO mice (n = 6 WT, n = 6 D1 PCKO, n = 6 D3 PCKO, and n = 6 D5 PCKO), normalized to eEF2. (C) Body weight expressed as % of initial weight of WT and PCKO mice at D0 (n = 7 WT and n = 9 PCKO). (D) Loss of fat and lean mass (%) at D3 and D5 in PCKO and WT mice compared with D0 (n = 7 WT and n = 9 PCKO). (E) Water content as % of body weight (n = 7 WT and n = 9 PCKO). (F) Food intake of WT and PCKO over the previous 24 h at D0–D5 (n = 7 WT and n = 9 PCKO). (G) WT and PCKO mice survival over time, from the start of TMX administration until D8 (n = 6 WT, n = 14 PCKO, n = 8 PZ, and n = 8 CZ). Statistics: Data reported as means ± SEM. (B) One‐way analysis of variance (ANOVA), Bonferroni post hoc test, * P < 0.05, PCKO vs. WT. (C–F) Two‐way ANOVA, repeated measures, Bonferroni post hoc test, * P < 0.05, PCKO vs. WT within each day; (G) Log‐rank (Mantel–Cox) test.