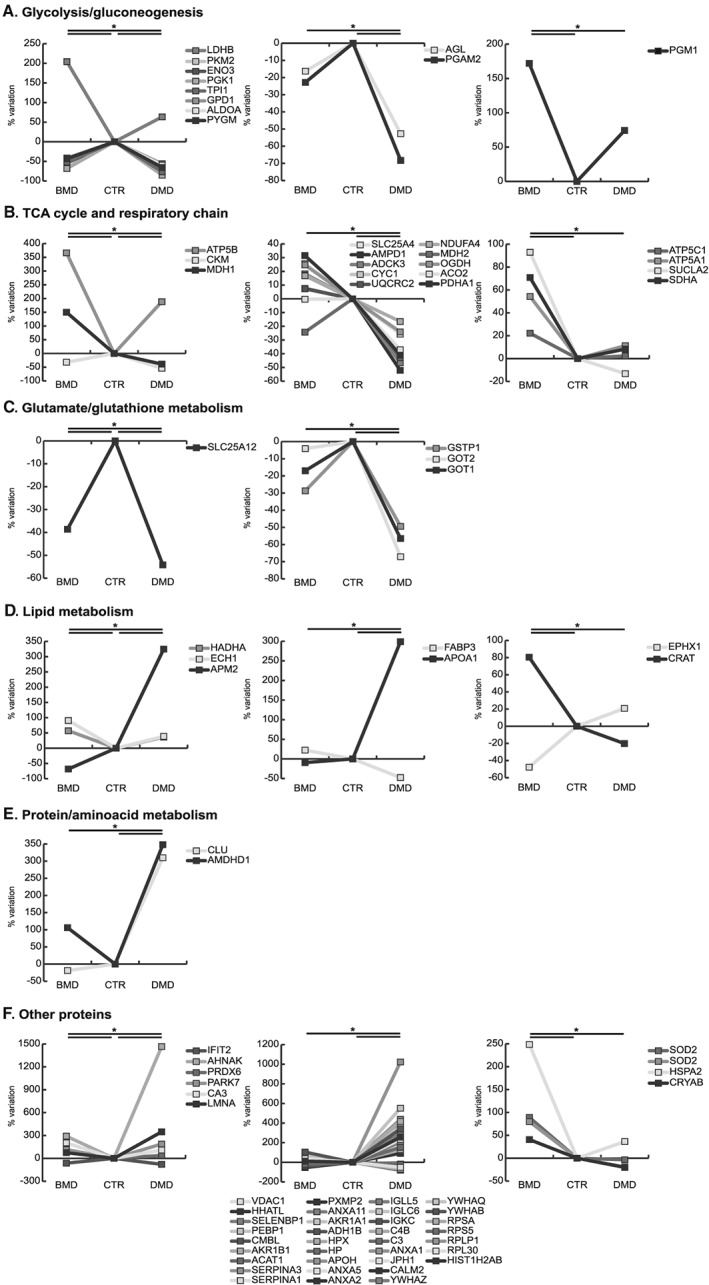
Figure 3.

Line charts illustrating metabolic proteins variation (%) in BMD and DMD samples compared with controls (CTR). Proteins were divided according to the significativity of the test (ANOVA and Tukey, n = 3, P‐value < 0.01). ANOVA, analysis of variance; BMD, Becker muscular dystrophy; DMD, Duchenne muscular dystrophy.
