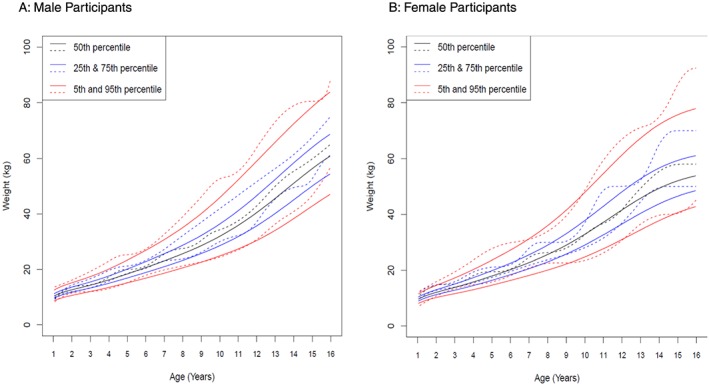
Figure 2.

Weight distribution curves stratified by sex. Weight distribution curves (5th to 95th percentile) for (A) male and (B) female participants from the Hospital for SickKids (dashed lines) are compared with Center for Disease Control (CDC) growth charts (full lines). Weight curves differ significantly (P < 0.0001) for male and female participants, with this study's cohort being slightly heavier.
