Figure 3.

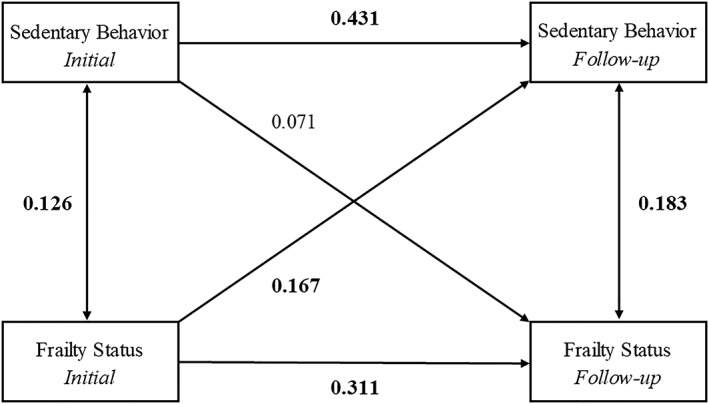
Cross‐lagged panel model 2: sedentary behaviour. Model adjusted for age, sex, body mass index, education, income, marital status, and mini‐mental scale examination. Bold indicates statistical significance (P < 0.05).

Cross‐lagged panel model 2: sedentary behaviour. Model adjusted for age, sex, body mass index, education, income, marital status, and mini‐mental scale examination. Bold indicates statistical significance (P < 0.05).