
Figure 3.
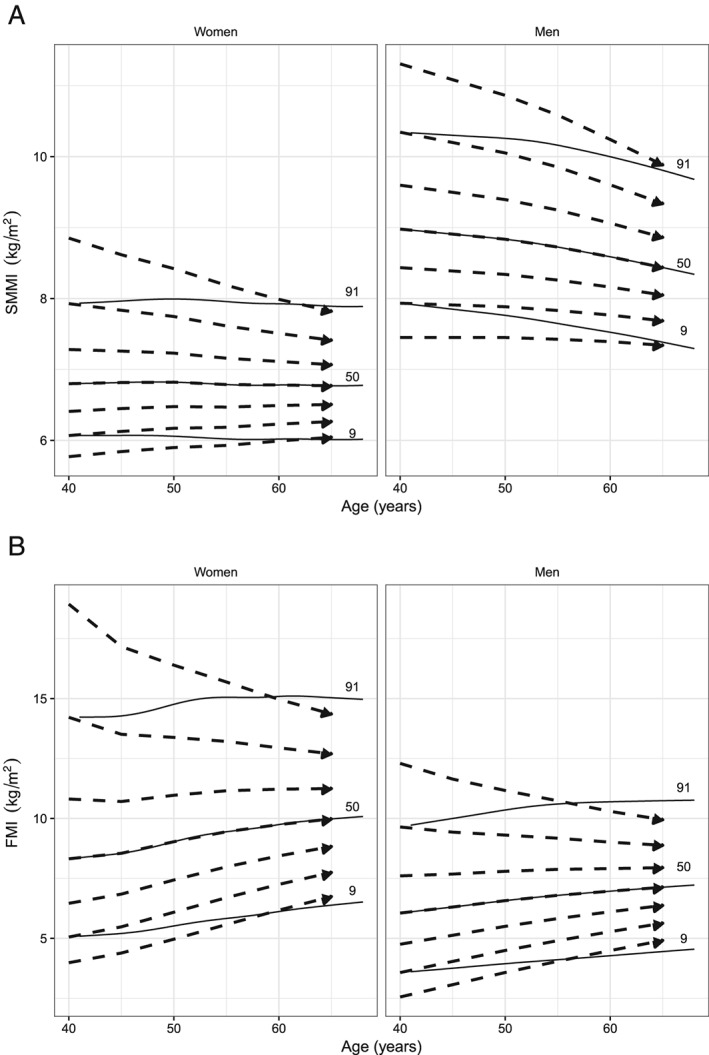
Longitudinal trajectories (dashed lines) of skeletal muscle mass index (SMMI) (A) and fat mass index (FMI) (B) values at 5 year intervals for 2nd, 9th, 25th, 50th, 75th, 91st, and 98th percentiles starting at age 40 for men and women, superimposed with the cross‐sectional percentiles (9th, 50th, and 91st) (solid lines).