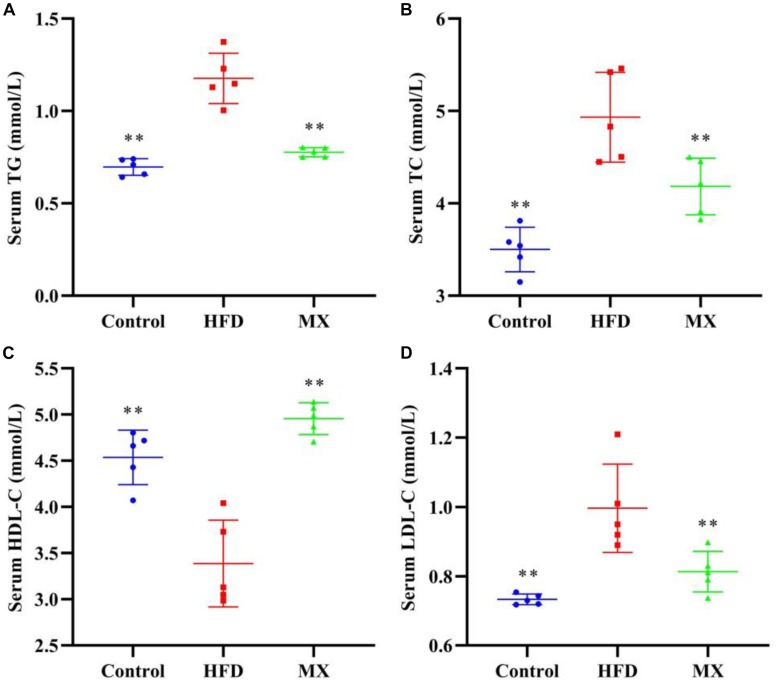
FIGURE 1.
Effects of mixed lactobacilli on blood lipids. Control, control group; HFD, high fat diet group; and MX, mixed lactobacilli group. (A) Serum triglyceride (TG) level; (B) Serum total cholesterol (TC) level; (C) Serum high density lipoprotein cholesterol (HDL-C) level; and (D) Serum low density lipoprotein cholesterol (LDL-C) level. All data are represented as mean ± SD. **p < 0.01: significant difference compared with mice in the HFD group.

