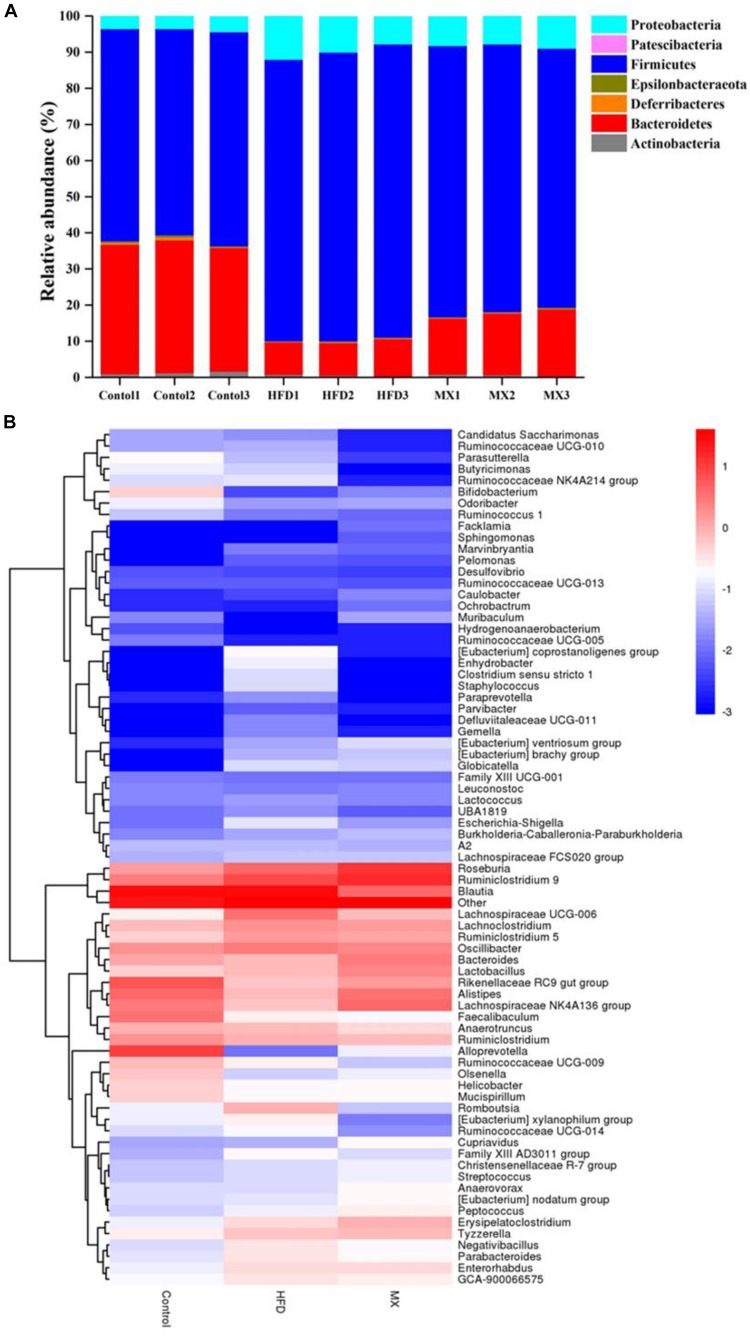
FIGURE 6.
Changes of the gut microbial population at the phylum level following mixed lactobacilli administration. Control, control group; HFD, high fat diet group; and MX, mixed lactobacilli group. (A) Stacked bar plot of gut microbiota composition at the phylum level; (B) Heatmap of gut microbiota composition at the genus level. n = 3 per group.

