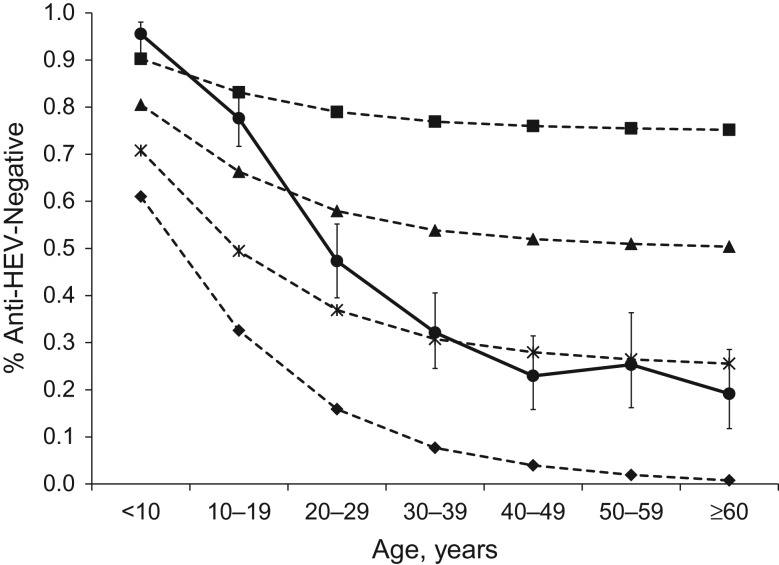
Figure 3.
Observed and expected prevalences of negativity for hepatitis E virus (HEV) antibodies (n = 1,009), by age group, accounting for different risks (risk ratios) of antibody loss, Matlab, Bangladesh, 2015. Observed antibody prevalence obtained from a 2003 study in Matlab (36) is indicated with a solid line. Expected antibody prevalence (dashed lines) was calculated from univariate Poisson regression with age at infection from the current follow-up study of antibody persistence (2015), assuming varying levels of population prevalence of HEV infection. All age groups were assumed to be equally likely to be infected with HEV. ■, 25% prevalence of HEV infection; ▲, 50% prevalence of HEV infection; X, 75% prevalence of HEV infection; ♦, 100% prevalence of HEV infection. Bars, 95% confidence intervals.

