
Fig. 1.
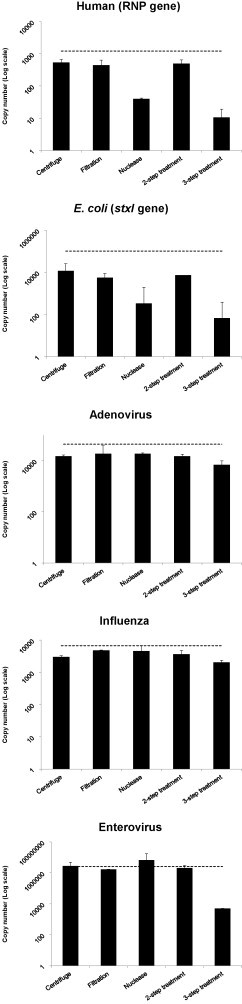
Amount of model organisms detected using quantitative real-time PCR, when different virus enrichment methods are applied. Amounts are measured as copy number of a target gene, represented as log10 values. The average of two independent replicates are shown, with two PCR tests performed per replicate. Error bars show the 95% confidence interval. The grey line represents the copy number of the target gene when no enrichment method is applied.