
Fig. 1.
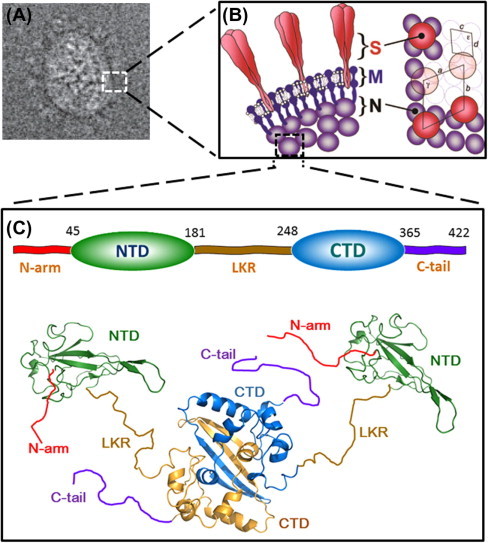
Structure of SARS-CoV N-protein. (A) 2D electron cryo-microscopy reconstructed image of SARS-CoV particle. (B) Interpretation of the virion structure. Edge view of the conserved structural proteins is shown on the left panel and the axial view is shown on the right panel. Trimeric spikes (S) are shaded in red, membrane proteins (M) are in solid blue, and nucleoproteins (N) are shaded in violet. The figures are reproduced with permission from Neuman et al. (2006). (C) The modular structural organization of SARS-CoV N protein. The domain boundaries shown on the top were defined by Chang et al. (2006a). The ribbon representations of the structures of NTD (green) and CTD (blue and gold) are generated with PyMOL from coordinates in the protein data bank (PDB IDs: NTD, 2OFX; CTD, 2CJR). The relative orientation of NTD and CTD, as well as the conformations of the disordered regions (N-arm, LKR and C-tail), are drawn randomly to reflect the dynamic nature of the N protein, as revealed by SAXS data (Chang et al., 2009). The ribbon structures were generated using PyMOL (The PyMOL Molecular Graphics System, Version 1.5.0.4 Schrödinger, LLC).