
Fig. 3.
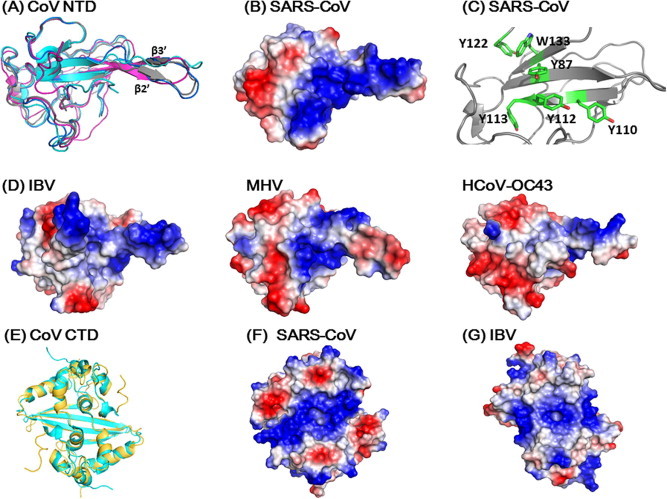
Structure comparisons of coronavirus N-proteins. (A) Structure comparison of various coronavirus NTDs (Grey: SARS-CoV, 2OFX; Magenta: IBV, 2GEC; Blue, MHV, 3HD4; Cyan: HCoV OC43. 4J3 K). The surface charge distributions on (B) (SARS-CoV) and (D) (IBV, MHV and HCoV OC43) are shown in same orientations. (C) Spatial arrangement of aromatic residues in NTD speculated to be involved in base stacking interaction when binding to RNA. Residues in the loop connecting β3 and β4 strands (a.a. Gly115-Gly130) have been removed for clarity. (E) Superimposition of the CTD structures of SARS CoV (gold, 2CJR) and IBV (cyan, 2GEC). The corresponding surface charge distributions were shown on (F) and (G) for SARS-CoV and IBV, respectively. All structures and surface charge distributions were generated using PyMOL.