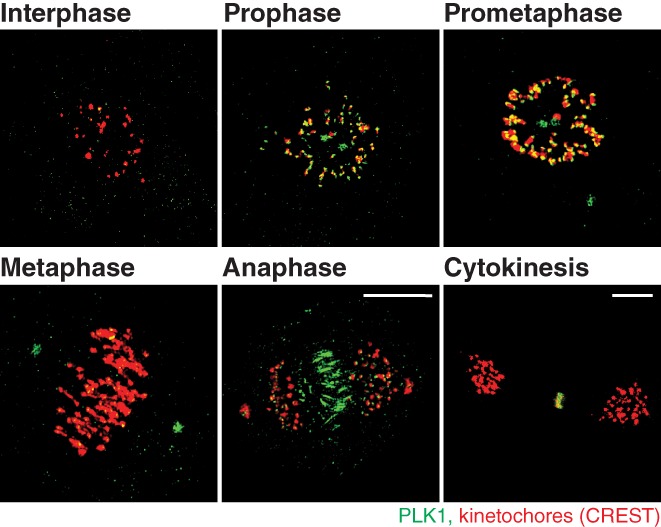
Figure 3.

PLK1 distribution throughout mitosis. Structured illumination microscopy (SIM) volumetric projection micrographs of RPE cells showing localization of PLK1 (green) from interphase through cytokinesis. Kinetochore marker: CREST (red). Unpublished SIM micrographs from Dr. Heidi Hehnly's lab, performed by Erica Colicino
