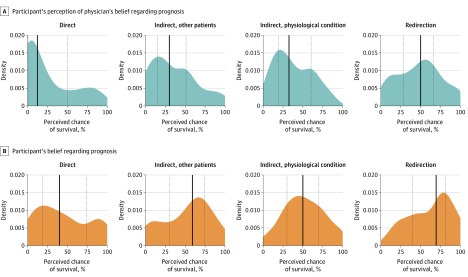
Figure 1. Comparison of Prognostic Estimates Among Family Members Stratified by Intensivist Response.
A and B, Density plots (smoothed, continuous versions of histograms estimated from the data) illustrate participants’ prognostic estimates for their family member with chronic obstructive pulmonary disease when answering the questions “If you had to guess, what do you think the doctor thinks is the chance that your loved one will survive this hospitalization?” (A) and “What do you think are the chances that your loved one will survive this hospitalization?“ (B) after viewing a video-recorded response of an intensivist answering the question “What do you think is most likely to happen?” during an intensive care unit family meeting. Participants were randomized to view 1 of 4 responses: direct, indirect referring to other patients, indirect referring to deteriorating physiological condition, and redirection to a discussion of the patient’s values. Solid black vertical lines indicate median value; dotted lines, interquartile range.

