
Figure 3.
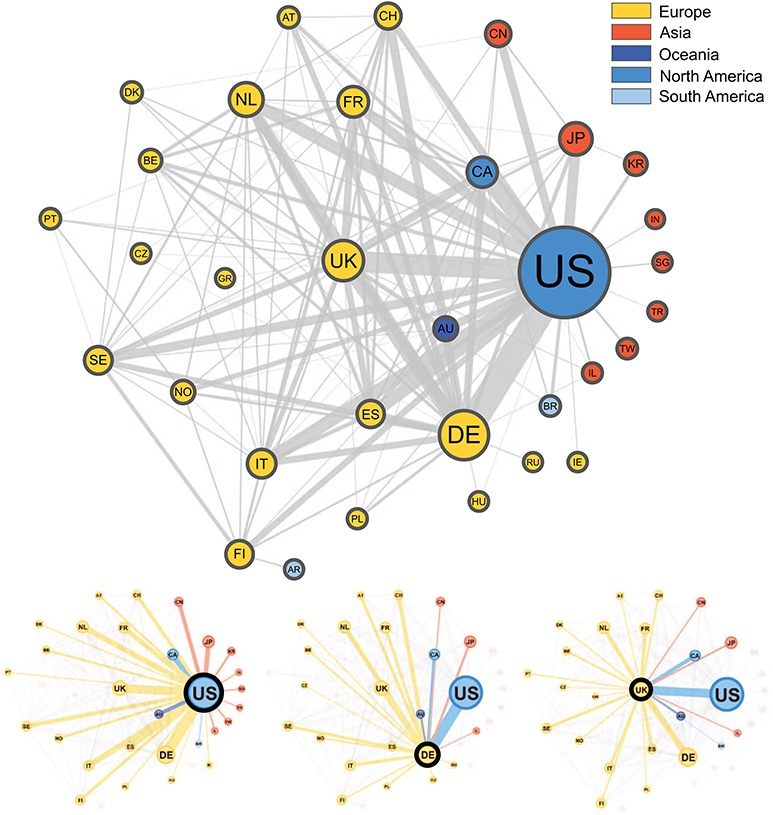
Graphical representation of the collaborations between countries based on 3093 publications contained in the Progenetix database. Collaborating countries for the three most frequent countries—the United States (US), Germany (DE) and the United Kingdom (UK)—are also shown in their own graphs. Node size is proportional to the country counts (linearly scaled between 10 and 50), node color represents the country’s continent and edge thickness is proportional to the collaboration counts. To reduce clutter in the graph, only countries appearing on more than seven publications appear in the graph, meaning our graph depicts  49% of all nodes and 29% of all edges in our data.