
Fig. 3.
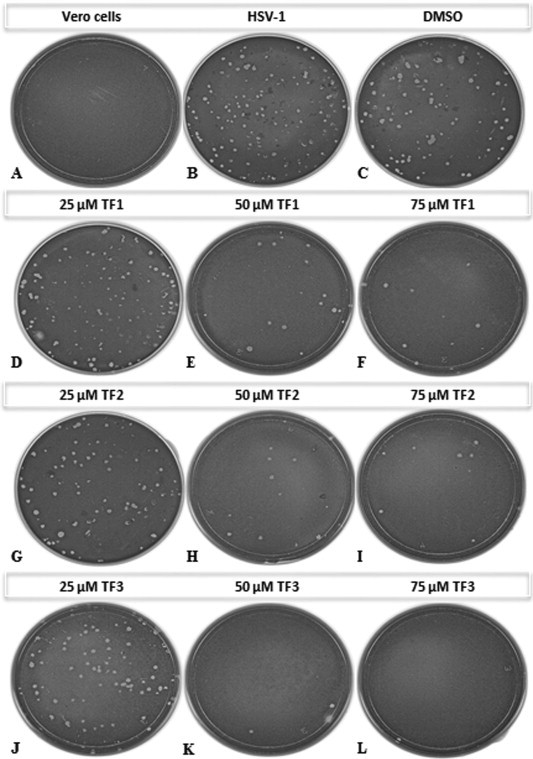
Plaque assay of HSV-1 treated or untreated with different concentrations of TF1, TF2, or TF3. (A) Vero cells only, (B) untreated HSV-1, (C) HSV-1 treated with DMSO, (D–F) HSV-1 treated with 25, 50, 75 μM TF1, (G–I) HSV-1 treated with 25, 50, 75 μM TF2, (J–L) HSV-1 treated with 25, 50, 75 μM TF3.