
Fig. 9.
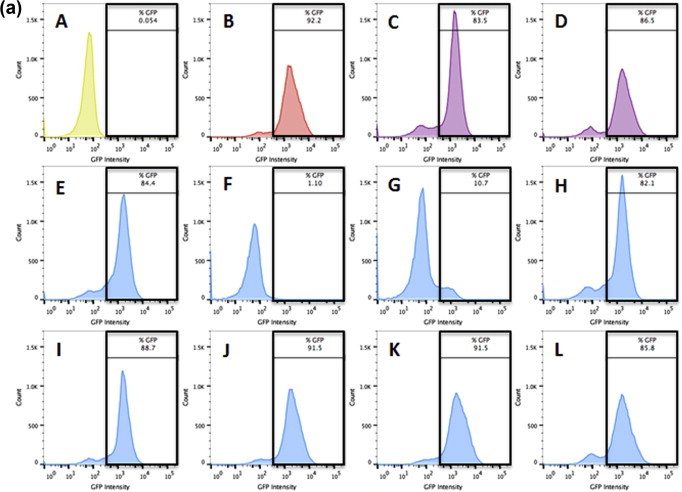
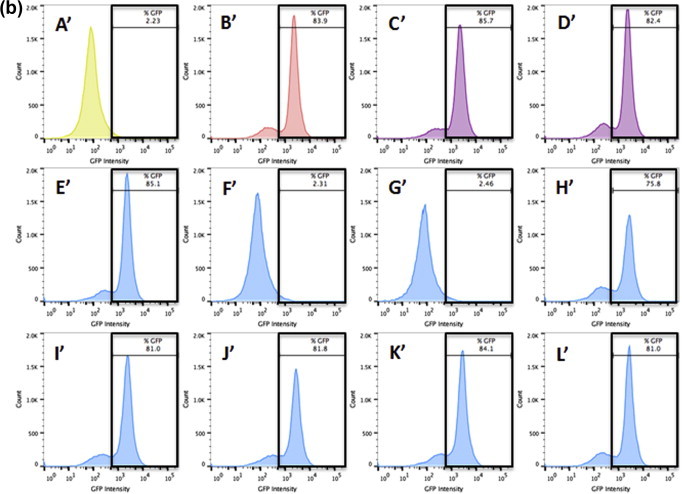
Flow cytometry analysis of binding/adsorption of untreated or 75 μM TF3 treated HSV-1 in infected Vero (9a) and A549 (9b) cells. The histograms depict GFP intensity from the GHSV-UL46 strain of HSV-1. (A) Vero cells only, (A′) A549 cells only (B, B′) Untreated HSV-1, (C, C′) DMSO treated HSV-1 at 2 h post infection, (D, D′) DMSO treated HSV-1 at 10 h post infection, (E, E′) Vero cells pre-treated with 75 μM TF3 for 1 h, (F, F′) HSV-1 pre-treated with 75 μM TF3 for 1 h, (G–L, G′–L′) HSV-1 treated with 75 μM TF3 for 1 h at 0, 2, 4, 6, 8, 10 h post infection.