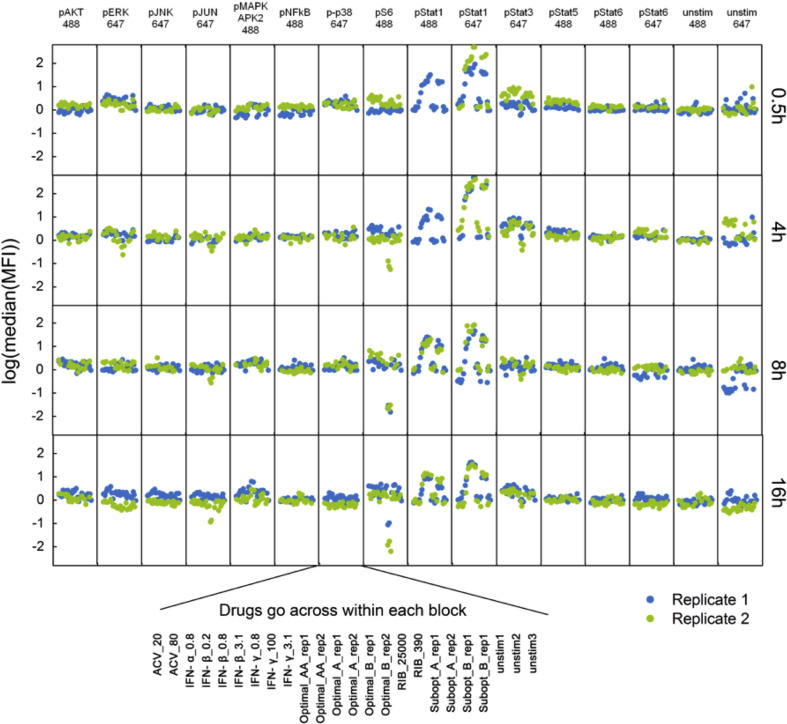
Fig. S1.
Panel of Phosphoprotein States in Stimulated Cells. The phosphoproteins are listed on the top of the figure, and the time points are listed to the right of the figure. Drug treatments run across each block in the figure. The median fluorescent intensity (MFI) is listed to the left of the figure. MFI staining correlates to the phosphorylation level of the stained protein. NIH 3T3 cells were treated with drug combinations for 0.5, 4, 8, or 16 h, respectively. The cells were then fixed, permeabilized, and fluorescently labeled with phosphospecific antibodies. The phosphoproteins were stained with either a 488 fluorescent tag or a 647 fluorescent tag according to established protocols [13]. All experimental data shown is representative data from three independent experiments.

