
Figure 1.
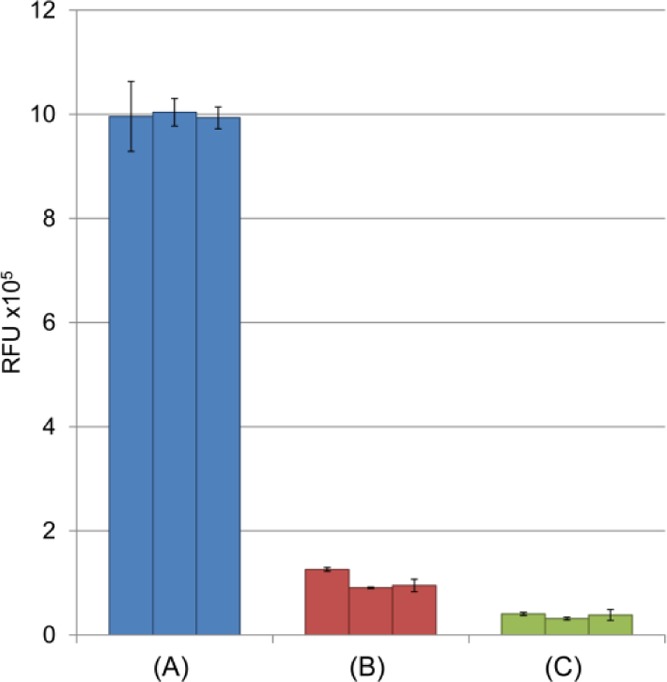
Optimization of the octanal cleanup procedure. Fluorescence intensity of 2-AB labeling solutions measured after: (A) one 600 μL octanal extraction and (B) two 600 μL extractions followed by one 100 μL extraction. (C) Fluorescence intensity of a blank with no 2-AB. Background was considerably reduced using optimized washing conditions (B). Samples were prepared in triplicate; each bar represents one sample which was divided into three individual wells; error bars represent the standard deviation of individual well measurements.