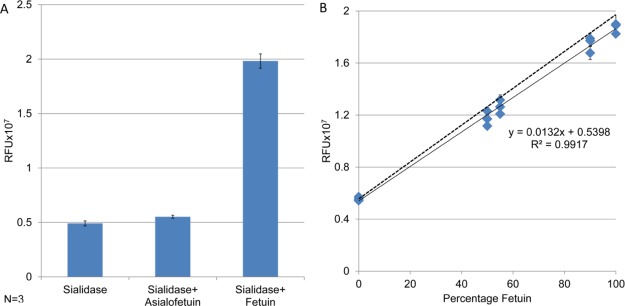
Figure 4.
Demonstration of method specificity, accuracy, and linearity for glycoproteins. (A) Fluorescent intensity of cleaved sialic acid from negative control, asialofetuin, and fetuin. (B) Calibration curve for fetuin and asialofetuin mixed in different ratios: the fluorescent intensity increases linearly with the sialylated fraction of the protein. The dotted line shows the fluorescence intensity expected from the calculated sialic acid content.

