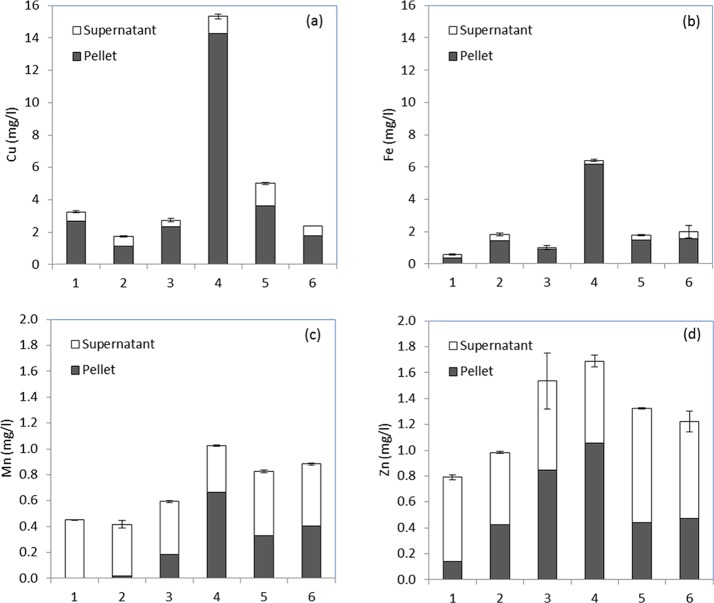
Figure 4.
(a) Cu, (b) Fe, (c) Mn, and (d) Zn content of pot ale samples (1–6) collected at different times from a malt whisky distillery and distribution between yeast solid (pellet) and soluble supernatant fractions. The mean of three determinations with SEM for the total sample is shown. The total and supernatant fractions were analyzed with the pellet fraction estimated by difference.

