

Abstract

Fe2As has been studied in situ by synchrotron powder X-ray diffraction (PXRD) over the range of temperatures 25–850 °C and under a neutral atmosphere to understand its thermal behavior, which is potentially important for gold extraction. For the first time, incongruent high-temperature reactions of Fe2As are observed as it breaks down and the existence of a previously undiscovered high-temperature FeAs phase with an NiAs-type structure has been determined experimentally. No evidence has been found for the existence of the high-temperature Fe3As2 phase. Hence, the previously published phase diagram for the Fe–As system has to be modified accordingly.
Introduction
Due to resource depletion of easily processed nonferrous and precious metals, metallurgical processing is increasingly moving toward refractory ores and concentrates with high arsenic (As) content. In this regard, the problem of As removal, and countering the problems it adds to the technological process of obtaining end product metals, becomes absolutely critical.
Iron arsenides may be the key to the extraction of gold from double refractory gold–arsenic-bearing carbonaceous ores, where gold is not extractable without significant ecological contamination from the associated arsenopyrite mineralization. By processing under reducing atmospheres in the presence of an iron-rich slag, certain proposed direct reductive melting (DRM) processes lock As into iron arsenide phases.1 The effectiveness of As removal from arsenic-bearing gold concentrates is directly associated with the decomposition of such iron arsenides. Hence, the development of the DRM process demands an improved fundamental understanding of the thermal behavior of the iron–arsenic phases of interest, especially the main constituent Fe2As diiron arsenide. There is no information on the thermal behavior of diiron arsenide in reducing and inert atmospheres, which are characteristic of the conditions of the DRM process.
Fe–As System
Initial interest in the Fe–As system originated from the need to minimize the negative ecological and environmental impacts of As resulting from metallurgical processing since it often accompanies nonferrous and precious metals in sulfidic ores. The application of As-containing compounds in electronic devices and the discovery of their thermoelectric and superconducting properties fueled further interest in the Fe–As system.
The Fe–As system has been extensively reviewed by Okamoto.2 The phase diagram of the Fe–As system is shown in Figure 1. The phases are α-As, FeAs2, FeAs, Fe3As2, Fe2As, α-Fe, and γ-Fe. The existence of a high-temperature Fe3As2 phase was previously postulated but never confirmed experimentally.2
Figure 1.

Phase diagram of the Fe–As system adapted from Okamoto.2 Line phases are shown in dark blue at room temperature and alternatively colored where polymorphs occur at high temperatures. The postulated stability field of the Fe3As2 phase is indicated.
The known minerals occurring in this system are loellingite (FeAs2) and westerveldite (FeAs). Crystallographic data of previously reported iron arsenides stable at room temperature are given in Table 1.
Table 1. Crystallographic Data of Iron Arsenides.
The congruent melting points of FeAs2, FeAs, and Fe2As are 1020,6 1030,7 and 919 °C7 (or 930 °C8), respectively. A high-temperature study of the stoichiometric FeAs phase showed that the MnP-type crystal structure remains virtually unchanged up to 1300 K (1027 °C).9 A high-pressure X-ray study of an FeAs single crystal did not reveal any deviation from the MnP structure throughout the applied pressure range.10
Studies on the Thermal Behavior of Iron Arsenides
Previous studies on the thermal behavior of iron arsenides under various atmospheres had two principal aims: first, a better understanding of dearsenication mechanisms of refractory gold–arsenic-bearing ores and concentrates and the optimization of gold recovery technologies and second, attempts to improve the commercial production of high-purity As in a vacuum. Information on the thermal behavior of iron arsenides in reducing and neutral atmospheres is very limited. Earlier studies on the thermal behavior of natural loellingite (FeAs2) at 450–800 °C and one atmospheric pressure reported that loellingite decomposes with the release of As and formation of FeAs.11 The thermal behavior of synthetic iron arsenides under vacuum (<0.0106 kPa) was studied by Tkach et al.12 Heating of the 0.074–0.14 mm grain-sized material at a rate of 10° min–1 indicated the following mechanism of decomposition:
| 1 |
In contrast, Isabayev et al.13 observed only one endothermic effect at 940 °C from the differential thermal analysis (DTA) curve of a synthetic iron diarsenide heated under a helium atmosphere.
A thorough investigation of the thermal behavior of iron arsenides FeAs2 and FeAs in a vacuum has been conducted previously.14 Arsenides were prepared by sintering a mixture of metallic arsenic and iron in evacuated quartz ampoules. The resulting synthetic iron diarsenide, according to the mineralogical and X-ray structure analyses, contained about 10% FeAs and had the formula Fe1.05As1.95. The synthesized iron monoarsenide contained about 2% FeAs2. An exothermic peak at 320–350 °C and an endothermic effect at 650–640 °C, accompanied by a loss of weight, were observed in the DTA analysis of FeAs2. The endothermic effect was attributed to the decomposition of iron diarsenide. The DTA study of FeAs showed an exothermic peak at 340–360 °C and an endothermic peak at 630–650 °C, accompanied by a slight decrease in mass. A noticeable loss of weight was observed at 820–830 °C. Powder X-ray diffraction (PXRD) and electron probe micro-analysis (EPMA) of the solid products of monoarsenide decomposition at temperatures above 800 °C revealed the presence of Fe2As. Diarsenide dissociation was investigated by in situ high-temperature X-ray diffraction when heating in a vacuum of 0.1 Pa over a temperature range of 25–900 °C. X-ray patterns were taken every 50–100 °C. It was found that FeAs2 decomposition commences at 400 °C and ends at 600 °C with the formation of FeAs. Visible decomposition of FeAs was observed at 650 °C and was completed above 800 °C with the formation of diiron arsenide Fe2As as a solid phase. The authors arrived at the conclusion that the thermal dissociation of iron diarsenide under vacuum has a stepwise nature
| 2 |
| 3 |
| 4 |
| 5 |
Thus, as is present in the form of diiron arsenide in the residues of thermal decomposition of arsenopyrite and iron arsenides at temperatures above 900–1200 °C, heated in an inert atmosphere or vacuum.12,14,15
Thus far, however, no single study has reported the thermal behavior of diiron arsenide. Hence, data on the thermal behavior of Fe2As in neutral and reducing atmospheres, which are characteristic of the conditions of any proposed DRM process, are essential. The aim of this study is to fill this gap in our understanding and study the thermal behavior of diiron arsenide by conducting in situ high-temperature synchrotron XRD of diiron arsenide. This is the first high-temperature structural study of Fe2As.
Results and Discussion
The PXRD patterns of the Fe2As sample (Figure 2) show three noticeable phase transformations in the sample upon heating. The sample composition remains unchanged until about 300 °C, when magnetite, Fe3O4, and FeAs are formed. The second phase transformation in the system occurs at around 650 °C, where magnetite transforms into wuestite FeO (Figure 3). It is known that, under low oxygen fugacity, magnetite is more stable than wuestite at lower temperatures.16 The magnetite reaction to produce wuestite probably involves the consumption of Fe2As and further formation of FeAs according to reaction 6
| 6 |
The final transformation takes place at 800 °C, when the known phase of FeAs disappears to be replaced by a phase displaying new unidentified peaks that appear in the PXRD plot (Figure 2). These unidentified peaks disappear upon subsequent cooling below 650 °C, at which point the phase reverts to the familiar structure of FeAs as seen during heating. The peaks were found to belong to a new high-temperature polymorph of FeAs (see below).
Figure 2.

Plot of the PXRD experimental patterns of the Fe2As sample upon heating and cooling.
Figure 3.
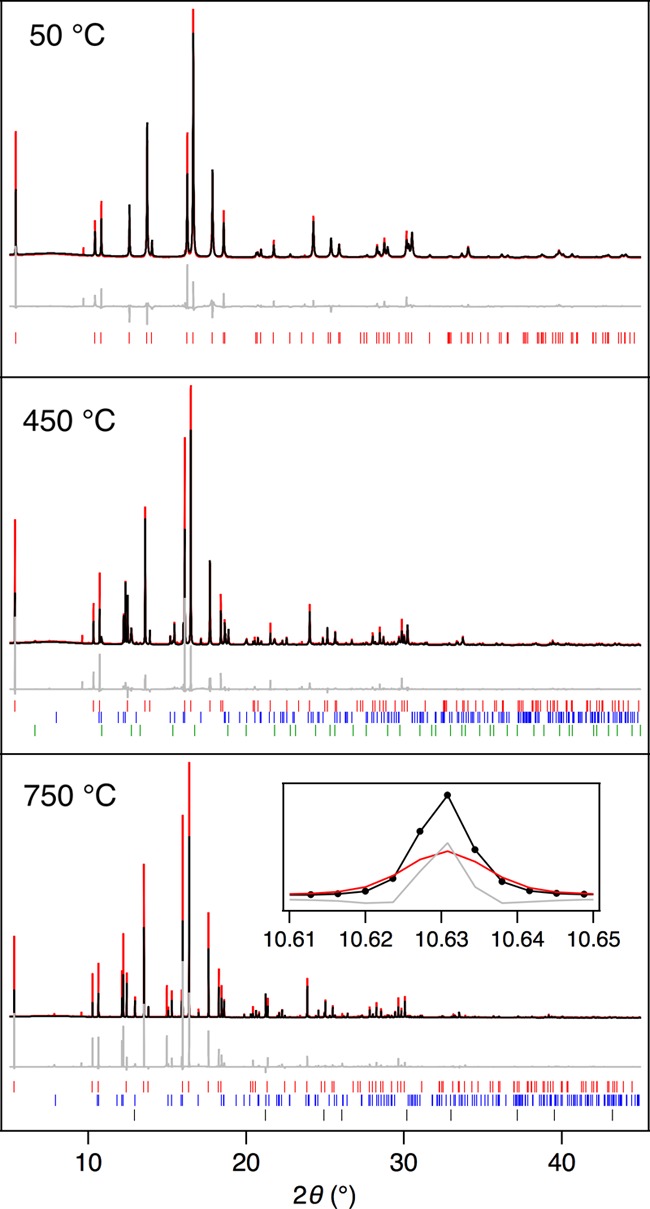
Rietveld refinement of the PXRD patterns of Fe2As. The experimental (black), calculated (red), and difference (gray) curves are shown. Peak marks: red—Fe2As, blue—FeAs, green—Fe3O4, and black—FeO.
Experimental, calculated, and difference curves of the final fit for three representative temperature steps for the experiment performed with the Fe2As sample are shown in Figure 3. It should be noted that the formation of very minor amounts of silicate phases (including fayalite) arises during the experiment as a result of chemical reactions between the iron arsenide compound(s) with the silica glass tube walls of the capillary container.
Crystal Structure Solution of a New High-Temperature Phase of FeAs
At 800 °C, the diffraction peaks corresponding to the MnP-type phase of FeAs disappear and some new peaks develop in the pattern. Upon closer analysis, most of these new peaks were in fact triplets and only a few minor ones were single peaks (Figure 4a,b). The single peaks were identified as fayalite. It is known that at low oxygen fugacity, wuestite reacts with SiO2 (present as the capillary wall) to form silicates.17
| 7 |
This distinction was possible because of the excellent data quality. The interpretation is that a new phase has grown as three individual large single crystals and triplet reflections were caused by quasi-single-crystal scattering artifacts; when one or a few bigger crystals are present in the polycrystalline powder in a 0.1 mm thick capillary, their reflections appear to be shifted compared to the expected peak position. Such quasi-single-crystal peak intensities are also affected strongly by the preferred orientation as their orientation is not randomized. No known iron and/or arsenic compound matches the new triplet peaks, including oxides and silicates.
Figure 4.

Example of parts of the diffraction patterns of our sample at 800 °C: (a) single peak and (b) triplet peaks.
Therefore, the triplet peaks were carefully selected and fitted using a single pseudo-Voigt peak shape. The peak positions and intensities thus calculated were extracted together with the background to produce a synthetic diffraction pattern (Figure 5). As Figure 6 shows, there is virtually no overlap between the triplet peaks and the other peaks in the diffraction pattern. Indexing in cubic, hexagonal, trigonal, and tetragonal symmetries was attempted with the indexing algorithm DICVOL,18 which is included in the software DASH19 from the CCDC suite.20
Figure 5.

Final Rietveld refinement plot of the high-temperature FeAs phase. The observed (black), calculated (red), and difference (gray) patterns and peak marks for a new phase are shown. The observed pattern has been obtained by fitting the triplet unidentified peaks of the data obtained at 800 °C with single pseudo-Voigt peaks.
Figure 6.

Synthetic pattern (red curve) and experimental pattern (gray curve) of Fe2As at 800 °C, and the relative calculated pattern (blue curve) from the Rietveld refinement (including fayalite). Curves have been displaced vertically to aid observation.
Among others, a hexagonal unit cell with a volume of 73 Å3 gave an excellent Pawley fit, yielding a and c equal to 3.9439(4) and 5.3897(6) Å, respectively. Space group statistics suggested a 63 screw axis along [0 0 1] and a c glide plane along [1 1 0]. A Pawley fit using space group P63/mmc—one of the most common space groups in the ICSD database21—gave the same χ2 as for space group P6. Before attempting any structure solution trial, we searched in the ICSD database for compounds with cell parameters similar to our refined results to within 3%. Amongst a number of binary compounds with a nickeline (NiAs)-type structure, a CoTe phase (ICSD collection code 53090), isostructural to nickeline (NiAs),22 was found. Atoms were replaced with Fe and As in the corresponding atomic positions. As can be seen from Figure 5, this structure fitted the experimental data well. The difference curve shows that some of the peaks are slightly shifted (see the inset in Figure 5). Rather than a problem with the cell symmetry and parameters, we believe that this is due to the way this synthetic pattern was created from an experimental powder pattern affected by single-crystal artifacts. Assuming that this high-temperature FeAs phase is in fact dominated by three big single crystals, then these crystals would most likely be oriented differently. A misorientation between the crystals also combines with the preferred orientation effect, yielding different intensity ratios for different triplets. This affects the synthetic pattern peak positions giving rise to relatively minor misfit features in the final Rietveld plot (see the difference profile of the Figure 5 inset). A Rietveld refinement on this synthetic pattern converged with χ2, Rwp, and RBragg equal to 0.86, 5.76%, and 3.47%, respectively.
A transition from an MnP-type to a high-temperature NiAs-type structure has been observed previously for many transition metal arsenides including TiAs, VAs, CrAs, (Mn,Fe)As, CoAs, and NiAs. Heyding and Calvert mentioned the possibility of a phase transition in FeAs below its melting point. However, they were not able to obtain satisfactory diffraction data, due to the attack of the silica capillaries above 900 °C.17 Selte et al. did not observe any structural changes in FeAs up to its melting point at 1070 ± 20 °C in their X-ray and neutron diffraction studies.9 However, in their later work, Selte et al. suggested the possibility of phase transition in FeAs.23 Although the existence of this high-temperature NiAs-like structure for FeAs was suggested, it has never before been experimentally observed for pure FeAs. Its stability field is indicated by the red portion of the line phase of FeAs shown above in Figure 1.
The two different crystal structures are given in Figure 7 for comparison. It should be noted that the NiAs-type FeAs phase found here is only stable over a very limited temperature range. The variation in the phase composition of our sample as a function of temperature is given in Figure 8.
Figure 7.

Crystal structures of FeAs phases: MnP-type (top) projected along the a axis and NiAs-type (bottom) projected along the c axis. As atoms and Fe atoms are light gray and dark gray, respectively.
Figure 8.

Composition of our sample as a function of temperature as obtained from the Rietveld analysis. The estimated standard deviations were found to be smaller than the symbols.
Finally, based on the phase diagram of the Fe–As system given by Okamoto,2 and taking into account the experimental conditions (heating up to 850 °C and inert atmosphere) as well as the composition of the sample, the following phases can be identified in the studied sample: FeAs, Fe2As, Fe3As2, and α-Fe (Figure 1). However, in this study, we found no evidence for the presence of an HT Fe3As2 phase. The stability field of Fe3As2 has always been considered ambiguous.2 The existence of Fe3As2 below 800 °C was initially proposed by Friedrich.7 Hagg believed that a high-temperature Fe3As2 phase was stable only above 795 °C.4 Heyding and Calvert found no indication of the high-temperature Fe3As2 phase in iron–arsenic alloys quenched from temperatures above 800 °C17 but did not attempt to do experiments above 795 °C. According to Sawamura and Mori, Fe3As2 decomposes eutectoidally at 824 °C.8 Earlier studies were conducted ex situ on heated and quenched or cooled products. This hinders access to intermediate transformation products and therefore could not provide information about the full process of phase transformation. Our in situ PXRD experiment did not suggest the existence of the high-temperature Fe3As2 phase at temperatures from 795 to 850 °C (Figure 1).
Reference cell parameter data for Fe2As and FeAs and those obtained in this study are given in the Supporting Information (Tables S2 and S3). The thermal expansion of cell parameters and volume of FeAs with temperature was calculated according to expression 8 and is in good agreement with the data reported by Selte et al.9 (Table 2).
| 8 |
Table 2. Thermal Expansion Coefficients of FeAs.
| α |
||
|---|---|---|
| unit cell | this study | Selte et al.9 |
| a | 14 × 10–6 K–1 (723–1023 K) | 14 × 10–6 K–1 (775–1275 K) |
| b | 46 × 10–6 K–1 (523–1023 K) | 42 × 10–6 K–1 (375–1075 K) |
| c | 25 × 10–6 K–1 (523–1023 K) | 23 × 10–6 K–1 (425–1275 K) |
| V | 100 × 10–6 K–1 (673–1023 K) | 104 × 10–6 K–1 (975–1325 K) |
Conclusions
Our temperature-dependent study of a starting diiron arsenide compound allowed ambiguities in the Fe–As binary system to be resolved. For the first time, the existence of a high-temperature FeAs phase with an NiAs-type structure has been demonstrated. In addition, no experimental evidence is found for the presence of a high-temperature Fe3As2 phase. Hence, the phase diagram for the system Fe–As has to be modified accordingly.
Preliminary in situ high-temperature PXRD data and identification of various phases upon thermal dissociation of diiron arsenide provide evidence related to phase transformations of iron arsenides upon heating, which is important in defining the thermodynamic state of these materials in real applications.
Experimental Methods
In situ high-temperature powder X-ray diffraction was conducted at the Materials Science Beamline of the Swiss Light Source (SLS) of the Paul Scherrer Institute (PSI), Switzerland.24 This diffractometer yielded an exceptionally high angular resolution and data quality; despite the small binning step (0.0036°), some of the sharpest peaks appeared undersampled, with less than five data points above the half maximum (inset in Figure 3). This complicated the peak fitting somewhat. Nevertheless, the data quality allowed for high precision cell parameters to be determined and the identification of unexpected high-temperature phases including a new previously unreported high-temperature phase of FeAs. The experiments were performed at the powder diffraction station of X04SA using monochromatic radiation (λ = 0.56502 Å). The starting FeAs2 samples were ground using a mortar and a pestle manually, sieved through a 75 μm sieve, mixed, and weighed. The preparation of the samples required the use of a glovebag under nitrogen to prevent the oxidation of As. The experiments simulated the conditions of the DRM process. Samples of 99.5% Fe2As (commercial, Alfa Aesar) were thus loaded under nitrogen into quartz capillaries with an internal diameter of 0.1 mm and sealed. Phase changes were monitored throughout the heating and cooling profile by in situ PXRD.
Raw diffraction data were processed and merged using in-house software. The structural changes associated with limits of stability were determined by Rietveld analysis. Parametric Rietveld refinements were performed using Topas V4.1.25 Parameters of the Mythen detector position and intensity correction model, the specimen displacement, the divergence slit, and the instrumental contribution for peak broadening using the Gaussian parameters of a pseudo-Voigt function were refined globally against the entirety of all datasets. This lowers the corresponding estimated standard deviations because of the larger number of observations and minimizes the overall number of free parameters. Simultaneously, background, phase compositions, unit cell dimensions, and microstrain-related Lorentzian peak broadening were refined individually for all phases at all temperatures. March–Dollase preferred-orientation corrections were applied to the (0 0 1) plane of Fe2As. The background was modeled with a Chebyshev polynomial function refined using 10 parameters. The refinements converged with a χ2 of 9.70–18.08 and an Rwp of 6.70–12.08. The starting structural data were taken from the Inorganic Crystal Structure Database (ICSD).26
Acknowledgments
This work was partly supported by the Islamic Development Bank—Cambridge International Scholarship Programme. We acknowledge additional funding from the British Council via the Newton Fund Institutional Links Programme, Award Number 172724105. We thank the Paul Scherrer Institute, Villigen, Switzerland, for the provision of synchrotron radiation beam time at the Materials Science Beamline of the SLS. We are grateful to the editor and anonymous referees for their valuable comments and suggestions that allowed us to improve the paper.
Supporting Information Available
The Supporting Information is available free of charge at https://pubs.acs.org/doi/10.1021/acsomega.9b03928.
Photograph of the experimental setup showing the solid-state silicon microstrip detector MYTHEN II (Microstrip sYstem for Time-rEsolved experimeNts); the starting structural data of all phases; reference cell parameter data; cell parameters of Fe2As and FeAs (PDF)
The authors declare no competing financial interest.
Supplementary Material
References
- Seitkan A.; Redfern S. Processing double refractory gold-arsenic-bearing concentrates by direct reductive melting. Miner. Eng. 2016, 98, 286–302. 10.1016/j.mineng.2016.08.017. [DOI] [Google Scholar]
- Okamoto H. The As-Fe (arsenic-iron) system. J. Phase Equilib. 1991, 12, 457–461. 10.1007/BF02645968. [DOI] [Google Scholar]
- Hagg G. X-Ray Studies on the System Iron Arsenide (in German). Z. Kristallogr. 1929, 71, 134–136. [Google Scholar]
- Hagg G. X-Ray Studies on the Binary Systems of Iron with Phosphorus, Arsenic, Antimony, and Bismuth (in German). Z. Kristallogr. 1928, 68, 470–471. [Google Scholar]
- Buerger M. J. The crystal structure of löllingite, FeAs2. Z. Kristallogr. – Cryst. Mater. 1932, 165–187. [Google Scholar]
- Clark L. A. The Fe-As-S system - Phase relations and applications. Econ. Geol. 1960, 55, 1345–1381. 10.2113/gsecongeo.55.7.1345. [DOI] [Google Scholar]
- Friedrich K. Iron and arsenic (in German). Metallurgie 1907, 129–137. [Google Scholar]
- Sawamura H.; Mori T. A Supplement to Investigation of Equilibrium Diagram of Fe-As-C System. Fac. Eng. Kyoto Univ. 1954, 182–189. [Google Scholar]
- Selte K.; Kjekshus A.; Andresen A. Magnetic structure and properties of FeAs. Acta Chem. Scand. 1972, 26, 3101–3113. 10.3891/acta.chem.scand.26-3101. [DOI] [Google Scholar]
- Lyman P.; Prewitt C. Room-and high-pressure crystal chemistry of CoAs and FeAs. Acta Crystallogr., Sect. B 1984, 40, 14–20. 10.1107/S0108768184001695. [DOI] [Google Scholar]
- Strathdee B.; Pidgeon L. Thermal decomposition and vapor pressure measurements of arsenopyrite and arsenical ore. Can. Min. Metall. Bull. 1961, 64, 883–887. [Google Scholar]
- Tkach M.; Tkachenko O.; Isakova L.; Ugryumova R. A. In O povedenii arsenidov zheleza pri nagrevanii v vakuume. Trudy IMiO AN Kaz. SSR, 1977; pp 54–60.
- Isabayev S.; Pashinkin A.; Mil’ke E.; Zhambekov M.. Fiziko-khimicheskiye osnovy sul’afidirovaniya mysh’ayaksoderzhashchikh soyedineniy; Nauka: Alma-Ata, 1986. [Google Scholar]
- Khrapunov V.; Isakova R.; Spivak M.; Fedulov I. Dissotsiatsia diarsenida zheleza. Zh. Neorg. Khim. 1993, 784–785. [Google Scholar]
- Khrapunov V.; Spivak M.; Spitsyn V.; Khlystov A.; Isakova R.; Fedulov I. O termicheskom povedenii arsenopirita. Zh. Neorg. Khim. 1991, 2786–2790. [Google Scholar]
- Lindsley D. H. Experimental studies of oxide minerals. Rev. Mineral. Geochem. 1991, 69–106. [Google Scholar]
- Heyding R.; Calvert L. Arsenides of Transition Metals: The Arsenides of Iron and Cobalt. Can. J. Chem. 1957, 35, 449–457. 10.1139/v57-065. [DOI] [Google Scholar]
- Boultif A.; Louër D. Powder pattern indexing with the dichotomy method. J. Appl. Crystallogr. 2004, 37, 724–731. 10.1107/S0021889804014876. [DOI] [Google Scholar]
- David W. I.; Shankland K.; van de Streek J.; Pidcock E.; Motherwell W. S.; Cole J. C. DASH: a program for crystal structure determination from powder diffraction data. J. Appl. Crystallogr. 2006, 39, 910–915. 10.1107/S0021889806042117. [DOI] [Google Scholar]
- Groom C. R.; Bruno I. J.; Lightfoot M. P.; Ward S. C. The Cambridge structural database. Acta Crystallogr., Sect. B 2016, 72, 171–179. 10.1107/S2052520616003954. [DOI] [PMC free article] [PubMed] [Google Scholar]
- Urusov V.; Nadezhina T. Frequency distribution and selection of space groups in inorganic crystal chemistry. J. Struct. Chem. 2009, 50, 22–37. 10.1007/s10947-009-0186-9. [DOI] [Google Scholar]
- de Meester de Betzembroeck P.; Naud J. Étude par Diffraction-X de Quelques Composés du Système Ni-Co-Te Obtenus par Synthèse Thermique. Bull. Soc. Chim. Belg. 1971, 80, 107–116. 10.1002/bscb.19710800112. [DOI] [Google Scholar]
- Selte K.; Kjekshus A. Phase Transitions Between the MnP and NiAs Type Structures. Acta Chem. Scand. 1973, 27, 3195–3206. 10.3891/acta.chem.scand.27-3195. [DOI] [Google Scholar]
- Willmott P. R.; Meister D.; Leake S. J.; Lange M.; Bergamaschi A.; Böge M.; Calvi M.; Cancellieri C.; Casati N.; Cervellino A.; et al. The materials science beamline upgrade at the Swiss Light Source. J. Synchrotron Radiat. 2013, 20, 667–682. 10.1107/S0909049513018475. [DOI] [PMC free article] [PubMed] [Google Scholar]
- Coelho A.TOPAS-Academic; Coelho Software: Brisbane, Australia, 2007.
- Inorganic Crystal Structure Database. http://icsd.cds.rsc.org/search/basic.xhtml. Accessed September 15, 2015.
Associated Data
This section collects any data citations, data availability statements, or supplementary materials included in this article.