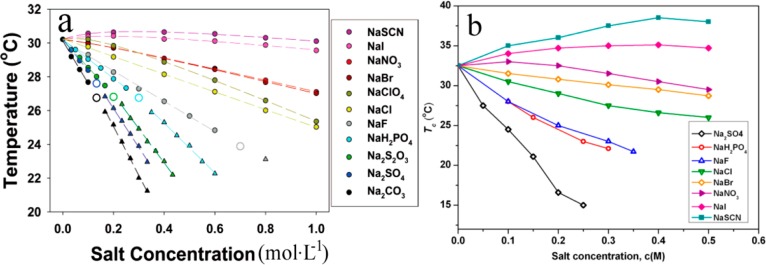
Figure 3.
(a) LCST values of PNIPAM determined in the presence of sodium salts at different concentrations (0 to 1.0 M). The dashed lines are curve fits to the data calculated from eq 1. (b) Change of the Tc of 10 g·L–1 HIPS solutions with the concentration of different sodium salts. Figure 3a was reprinted with permission from ref (12d). Copyright 2005 American Chemical Society. Figure 3b was reprinted with permission from ref (12a). Copyright 2013 American Chemical Society.

