
Fig. 4.
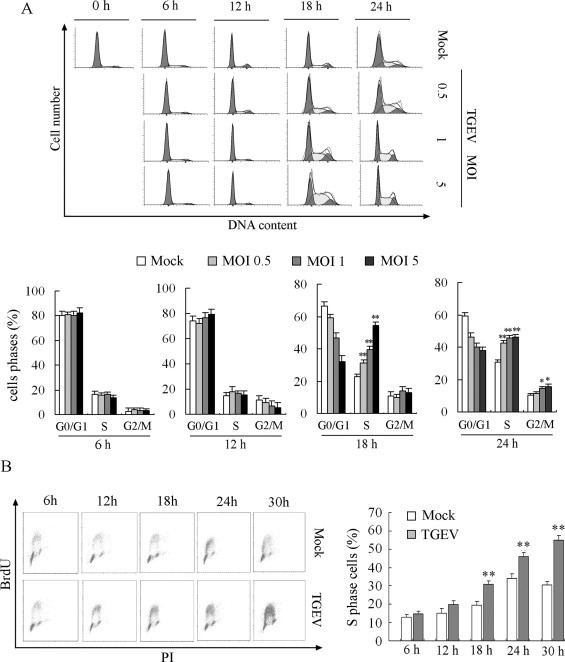
Effects of high MOIs of TGEV on cell cycle progression. (A) Serum-starved PK-15 cells were mock infected or infected with 0.5, 1 and 5 MOI of TGEV. Cell cycle profiles at the indicated times were determined by FACS analysis. The data are from one of three experiments (upper panel). The histograms were analyzed to determine the percentage of cells in each phase of the cell cycle. The results are shown as mean ± SEM of three independent experiments. *P < 0.05, **P < 0.01 versus mock infection. (B) Serum-starved PK-15 cells were mock infected or infected with 0.5 MOI of TGEV. Cells were co-stained with BrdU and PI and analyzed using flow cytometry. The histograms were analyzed to determine the percentage of cells in S phase of the cell cycle. S phase, upper gate; G1, lower left; G2, lower right. The results are shown as mean ± SEM of three independent experiments. **P < 0.01 versus mock infection.