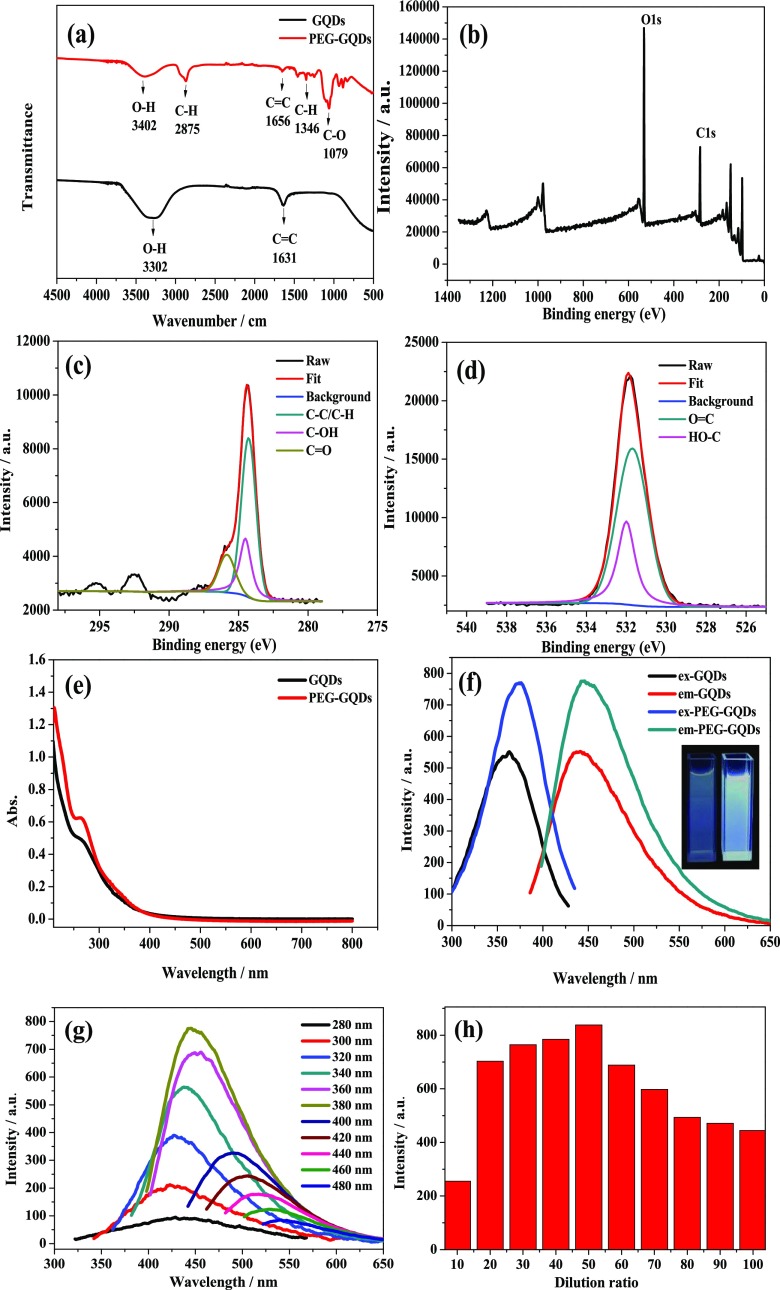
Figure 2.
(a) FT-IR spectra of GQDs and PEG-GQDs. (b) X-ray photoelectron spectroscopy (XPS) survey scan spectrum of PEG-GQDs. High-resolution XP spectra of (c) carbon and (d) oxygen of PEG-GQDs. (e) UV–vis absorption spectra of GQDs and PEG-GQDs. (f) Fluorescence emission spectra of GQDs and PEG-GQDs and the inset of the fluorescence photographs of GQDs (left) and PEG-GQDs (right). (g) Fluorescence emission spectra of PEG-GQDs recorded for progressively longer excitation wavelengths from 280 to 480 nm. (h) Diameter histogram of the effect of adding an amount of PEG on the fluorescence emission spectra of PEG-GQDs.

