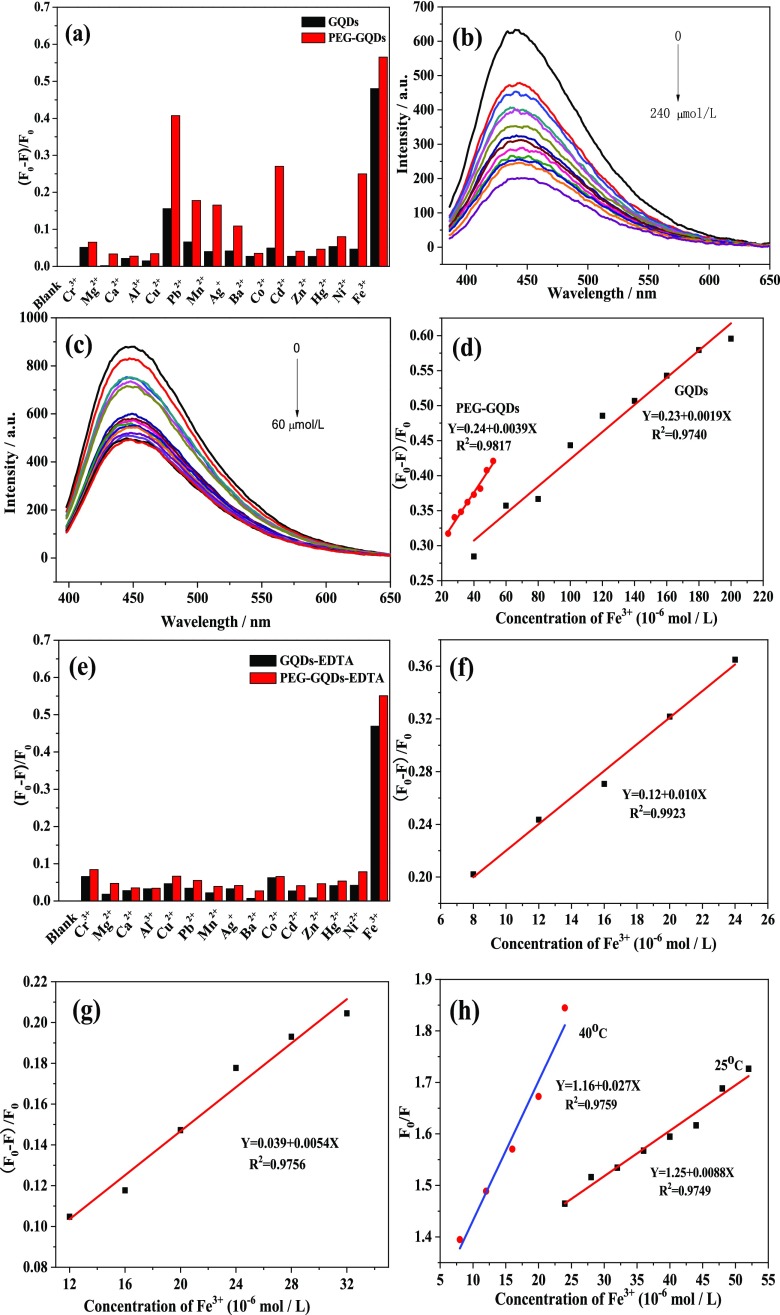
Figure 5.
(a) Fluorescence responses of GQDs and PEG-GQDs to the different metal ions in the absence of ethylenediaminetetraacetic acid (EDTA). (b) Fluorescence emission spectra of GQDs quenched by different concentrations of Fe3+ (from 0 to 240 μM) in a homogeneous solution. (c) Fluorescence emission spectra of PEG-GQDs quenched by different concentrations of Fe3+ (from 0 to 60 μM) in a homogeneous solution. (d) Calibration curves of the degree of fluorescence quenching [(F0 – F)/F0] of GQDs and PEG-GQDs versus Fe3+ ions concentration. (e) Fluorescence responses of GQDs and PEG-GQDs to different metal ions in the presence of EDTA. Calibration curves of the degree of fluorescence quenching [(F0 – F)/F0] of (f) PEG-GQDs and (g) GQDs versus Fe3+ ions concentration in the presence of EDTA, respectively. (h) Stern–Volmer curve for fluorescence quenching of PEG-GQDs by Fe3+ at different temperatures.

