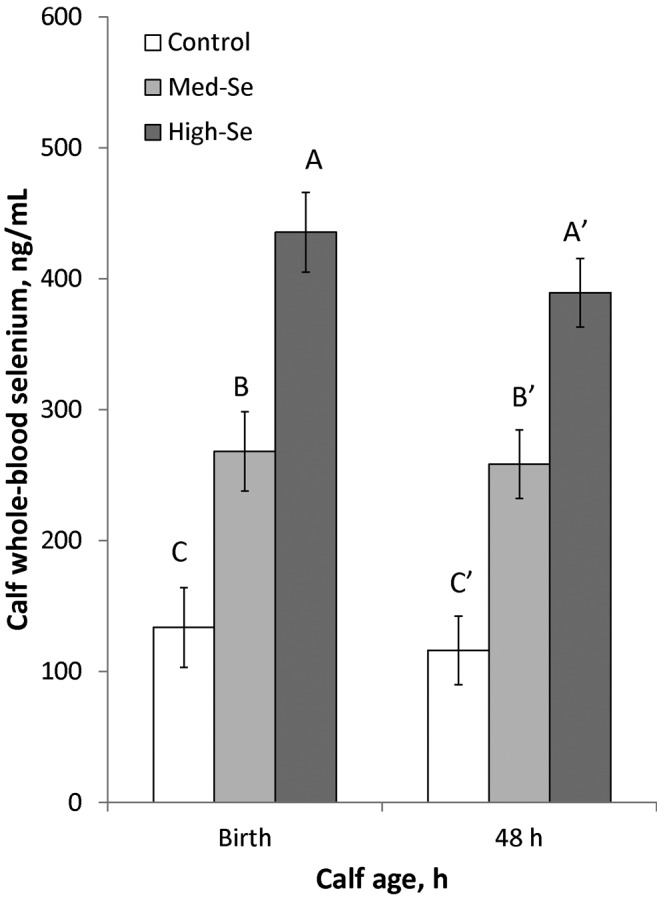
Figure 5.

Whole-blood Se concentrations (mean ± SEM) in newborn calves born to mothers consuming 2.5% BW/d alfalfa hay grown in a field not fertilized with Se (0 g Se/ha; Control cows) or harvested from fields fertilized with sodium selenate at application rates of 45.0 (Med-Se cows) or 89.9 (High-Se cows) g Se/ha for 10 wk ± 16 d before their expected calving date. Blood was collected within 2 h of calving and at 48 h of age. There were time (decreased from birth; P = 0.002), treatment (P = 0.003), and time × treatment interaction effects (time effect in High-Se calves and not in the other 2 treatment groups; P = 0.04). A–CValues that differ at P < 0.05 have different letters; A′ through C′ refers to time effects for treatments; letters are alphabetically ordered from largest to smallest values.
