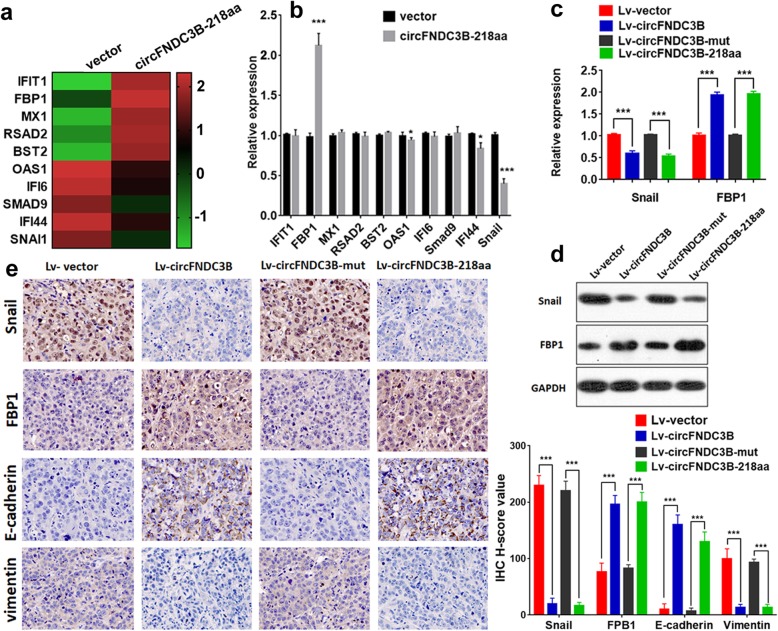
Fig. 6.
circFNDC3B-218aa regulated Snail and FBP1. a Heat map showed the top 10 significantly upregulated or downregulated differential genes expression between two groups. b qRT-PCR was used to evaluate the expression of the top 10 dysregulated genes. c qRT-PCR was used to evaluate the expression of Snail and FBP1 regulated by the four vectors. d Western blot was used to evaluate the expression of Snail and FBP1 regulated by the four vectors. e IHC analysis of Snail, FBP1, E-cadherin and vimentin in liver metastatic nodules. *P < 0.05, ***P < 0.001

