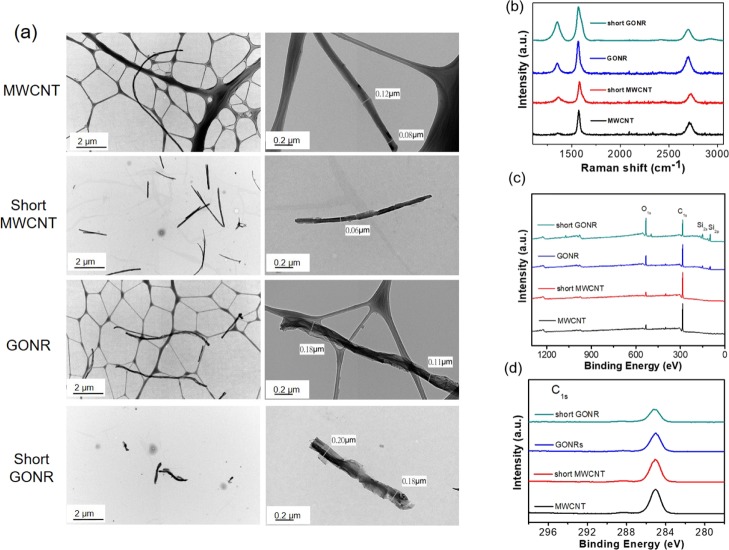
Figure 1.
(a) Low-magnification and high-magnification TEM picture of MWCNTs and GONRs. (b) Raman spectra of four nanocarbons. The D band of GONRs is higher than that of MWCNTs after the unzipping process. (c,d) display the X-ray photoelectron spectroscopy spectra of four nanocarbons. Apparently, the D′ peak is the most evident for short GONRs.

