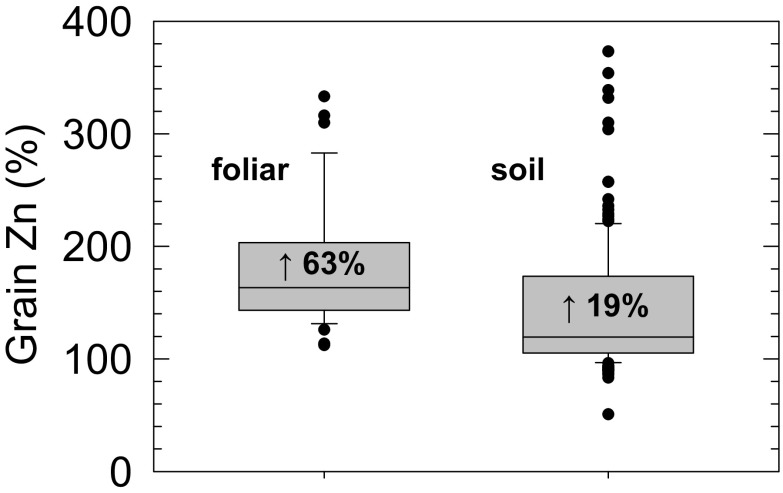
Fig. 5.
Increases in wheat grain Zn concentration as a result of foliar- or soil-applied/granular Zn fertilisers compared to unfertilised controls. Boxes represent the middle two quartiles; whiskers represent the 95 % confidence limits; outliers circled. Median increases are indicated by the horizontal line and text within the box. Data are from a literature-survey of Joy et al. (2015b)

