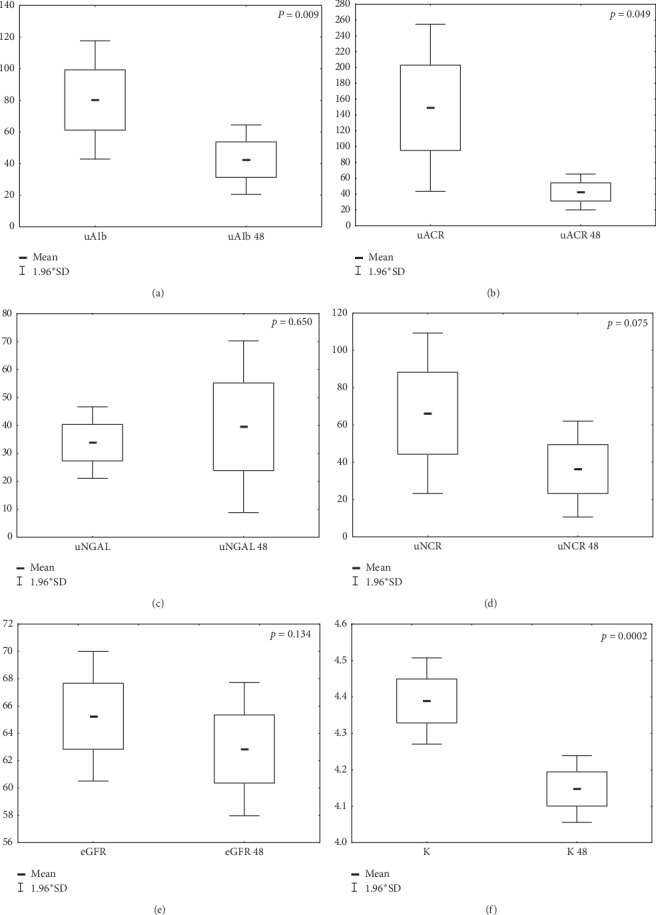
Figure 3.

Impact of CRT implantation on selected renal parameters across the entire group of patients 48 hours following implantation. (a) uAlb, urinary albumin concentration in a single morning sample of urine prior to CRT implantation; uAlb 48, albumin concentration in a single morning sample of urine 48 hours following CRT implantation. (b) uACR, urinary albumin to creatinine ratio prior to CRT implantation; uACR 48, urinary albumin to creatinine ratio 48 hours following CRT implantation. (c) uNGAL, lipocalin associated with neutrophil gelatinase in a single morning sample of urine prior to CRT implantation; uNGAL 48, lipocalin associated with neutrophil gelatinase in a single morning sample of urine 48 hours following CRT implantation. (d) uNCR, urinary NGAL to creatinine ratio prior to CRT implantation; uNCR 48, urinary NGAL to creatinine ratio 48 hours following CRT implantation. (e) eGFR, estimated glomerular filtration rate calculated using Chronic Kidney Disease Epidemiology Collaboration prior to CRT implantation; eGFR 48, estimated glomerular filtration rate calculated using Chronic Kidney Disease Epidemiology Collaboration 48 hours following CRT implantation. (f) K, serum potassium concentration prior to CRT implantation; K 48, serum potassium concentration 48 hours following CRT implantation.
