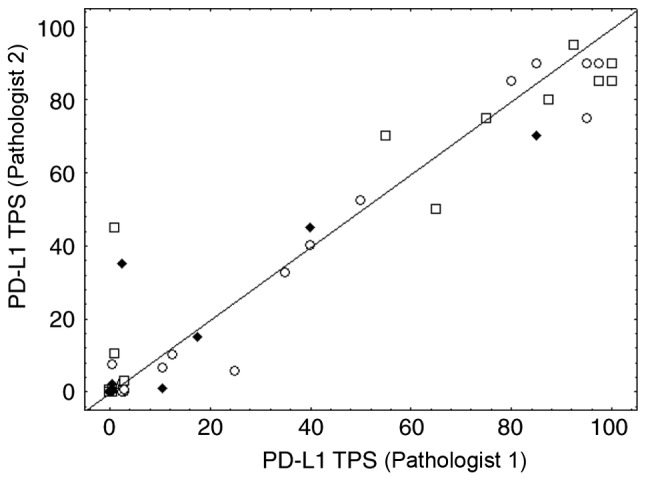
Figure 4.

Inter-observer concordance. Inter-observer concordance for the precise PD-L1 TPS assessments between pathologist 1 (junior) and pathologist 2 (senior). Dots, squares and diamonds represent surgery, biopsy and cytological samples, respectively. Some pairs with small values resulted in many overlaps. The value pair (0,0) was observed 33 times, the pair (0,0.5) 4 times, (0.5,0) 5 times, the pair (0.5,0.5) for 2 times and the pair (3,0.5) for 2 times. PD-L1, PD-L1 molecule; TPS, tumor proportion score.
