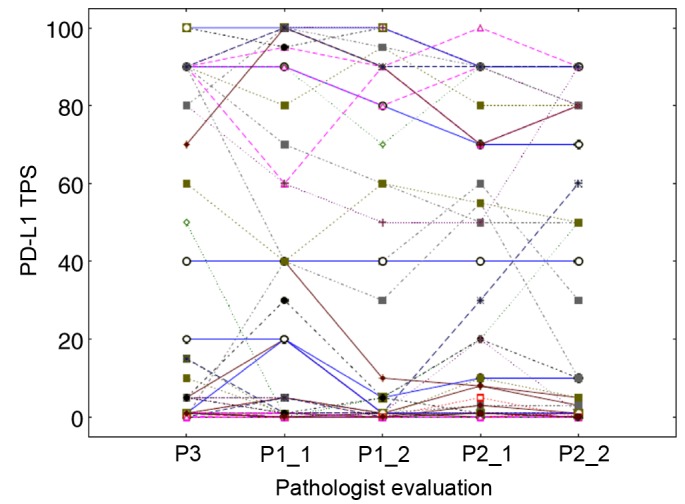
Figure 5.

Overview of the intra- and inter-observer variations. The PD-L1 TPS assessed by pathologist 3 (junior, 1 evaluation), pathologist 1 (junior, 2 evaluations) and pathologist 2 (senior, 2 evaluations) were linked per case. Each case is identified by a line with a specific shape and colour and connecting all pathologists' assessments. A total of 24 perfect agreements of the 5 assessments on the TPS value of 0 were observed, resulting in overlapping horizontal lines at level 0. PD-L1, PD-L1 molecule; TPS, tumor proportion score; P, pathologist.
