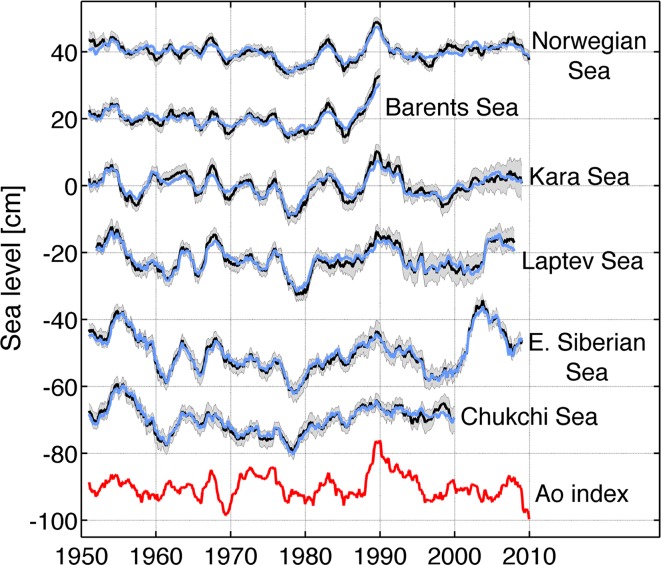
Fig. 13.
Low-pass-filtered (2-year running mean) time series of total (black line) and IB-corrected (blue line) sea level in six regions along the continental boundaries of the Arctic Ocean: in a counterclockwise order they are the Norwegian coast, Barents Sea, Kara Sea, Laptev Sea, East Siberian Sea, and Chukchi Sea. The AO index (red line) is also shown (scaled to have the same standard deviation as the average of the sea level time series). The gray-shaded area represents the uncertainty of the time series of total sea level. Adapted from Calafat et al. (2013)

