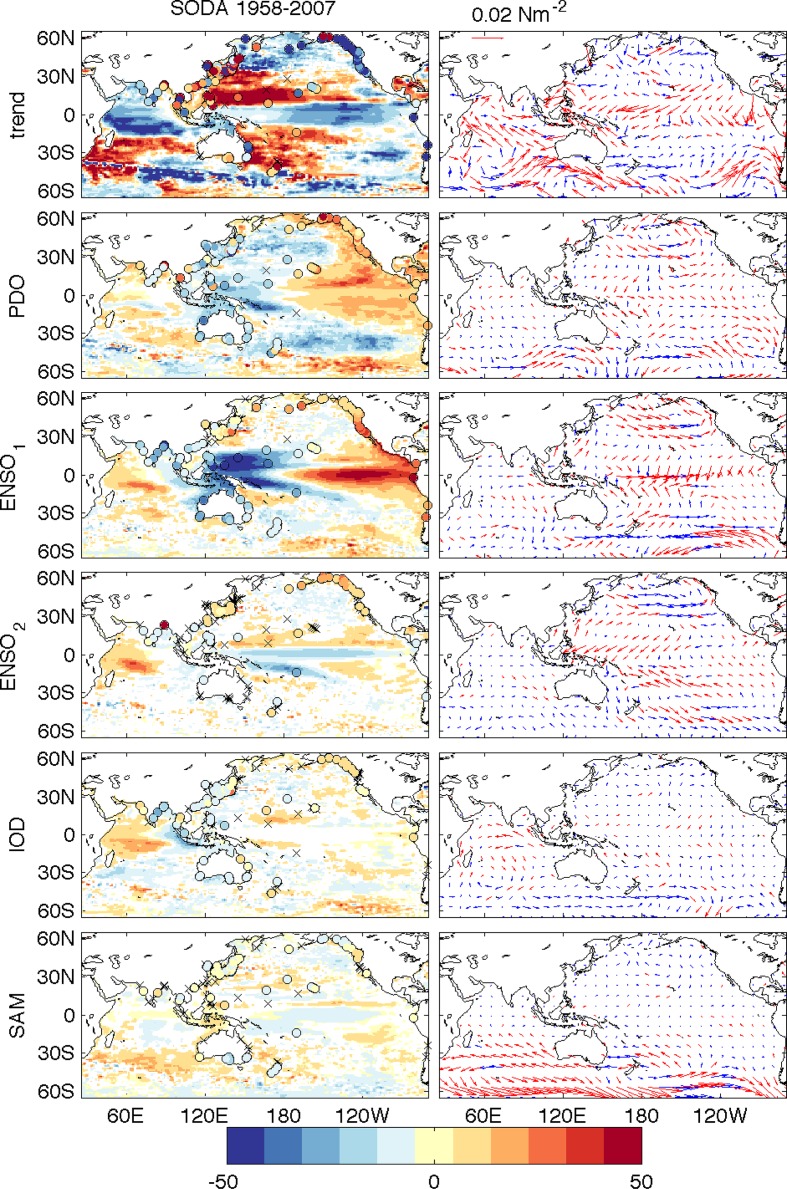
Fig. 3.
(Left column) Regression coefficients between climate indices and sea level from 50-year (1958–2007) SODA product over 65°S–65°N of the Indo-Pacific basin (25°E–70°W), (Right column) Regression coefficients between climate indices and surface wind stress from ERA40 wind before 2001 and ERA-Interim wind after 2001. Tide gauges are shown as colored circles, and crosses indicate where the tide gauge regressions are not significant. Red vectors indicate significance at 95 % level. All indices were smoothed using a 5-month running mean with long-term mean seasonal cycle removed. The PDO index has the high-frequency component removed by smoothing the monthly PDO index with successive 25- and 37-month running mean. Using IPO index yields similar results. The ENSO indices represent interannual variability, having the low-frequency component removed. The first ENSO index (ENSO1) is the commonly used Multivariate ENSO Index, and ENSO2 describes the nonlinear atmospheric response to SST anomalies associated with the combination of ENSO and the annual cycle (see Frankcombe et al. 2015 for details). From Frankcombe et al. (2015)

