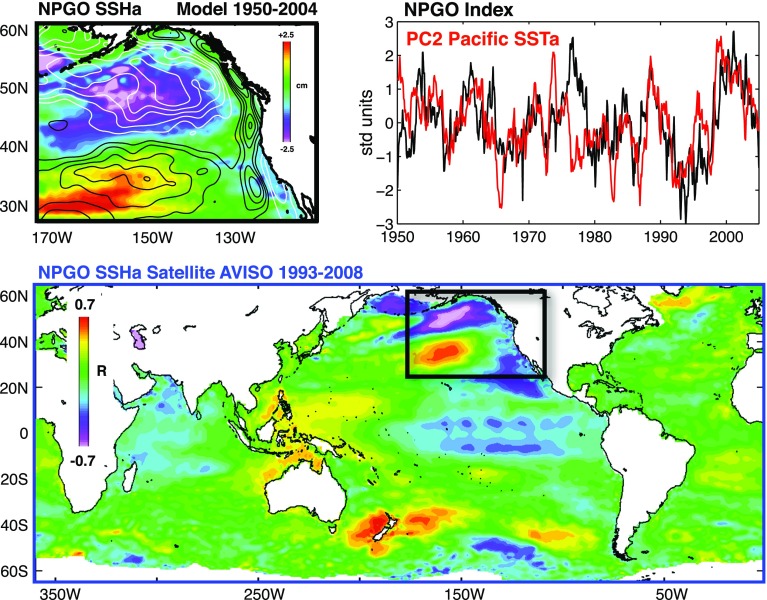
Fig. 5.
(Top left) The 2nd EOF pattern of monthly SSH anomalies from the output of a regional ocean general circulation model (OGCM) for the 1950–2004 period; (top right) The NPGO index (black curve) defined as PC2 of SSH anomalies (SSHa) from the OGCM output, and PC2 of Pacific SST anomalies from NOAA ERSST v3 from 1950 to 2004 (red curve); (Bottom) Correlation map between NPGO index and monthly mean AVISO SSHa or the 1993–2008 period. Figure provided by Dr. Emanuele Di Lorenzo

