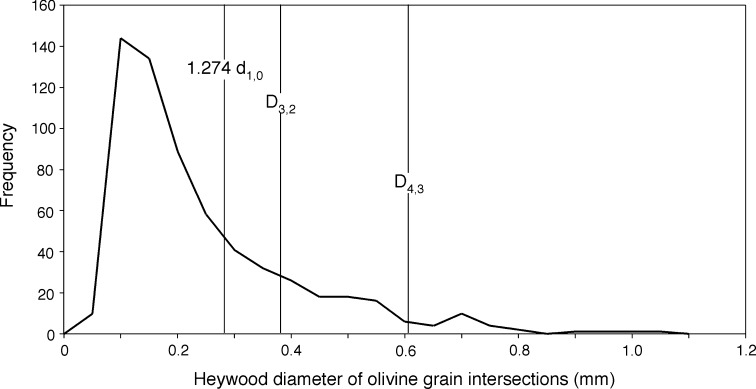
Fig. 13.
The frequency distribution of Heywood diameters measured for sample SC492 from the Lower Picrite (26.4 m stratigraphic height). Number of measurements is 617. The mean Heywood diameter (d1,0) is shown, multiplied by the factor 1.274—this measure provides a good indication of the true 3D diameter of a population of monodisperse spheres. For comparison the area-weighted mean diameter (D3,2) and the volume-weighted mean diameter (D4,3) are also shown. Data in Table 1

