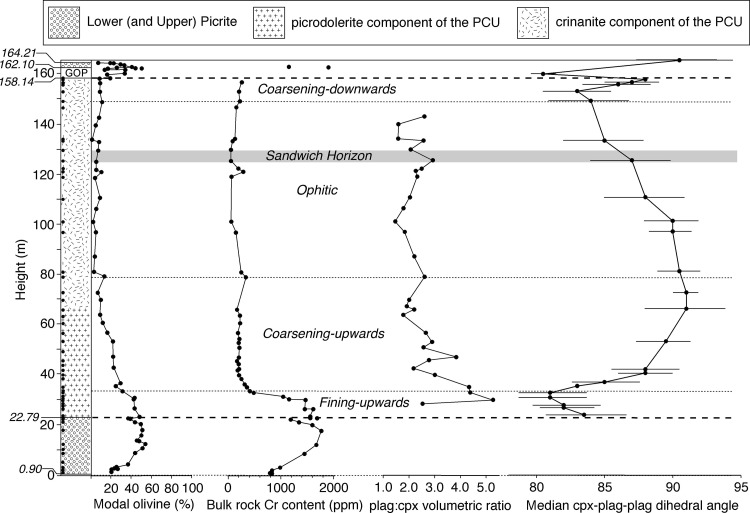
Fig. 2.
The stratigraphy of the Shiant Isles Main Sill (simplified from Gibb and Henderson (1996), omitting the bands of pegmatite at the top of the PCU and which were not examined during this study. GOP shows the stratigraphic distribution of the granular olivine picrodolerite (see text for details)), together with the stratigraphic variation of olivine mode (from Henderson et al. 2000), bulk rock Cr content in Hole 1 (from Fig. 8 of Gibb and Henderson (2006). Location shown in Fig. 1), augite-plagioclase-plagioclase dihedral angle, and the volumetric ratio of plagioclase to clinopyroxene (data from Gibb and Henderson 1996). The stratigraphic heights of the samples examined for the present study are shown by the black dots on the left side of the stratigraphic column. The horizontal dashed lines show the margins of the picrodolerite/crinanite unit, while the horizontal dotted lines show the boundaries between the four different subdivisions of the PCU on the basis of olivine morphology. The boundary between the fining-upwards and coarsening-upwards subdivisions is gradational (Fig. 6). The grey band shows the stratigraphic position of the most evolved rocks (from Gibb and Henderson 2006) which is the Sandwich Horizon where the roof and floor sequences meet

