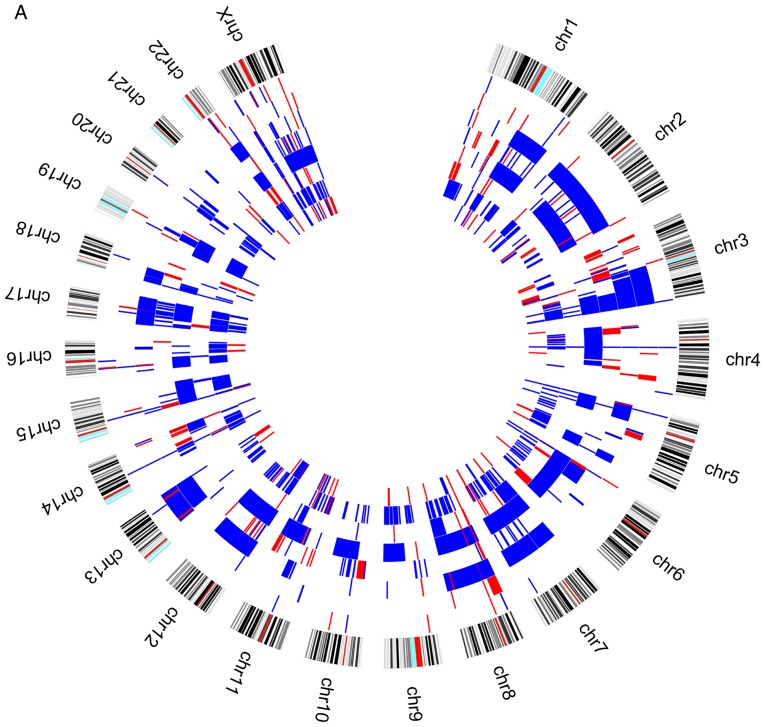
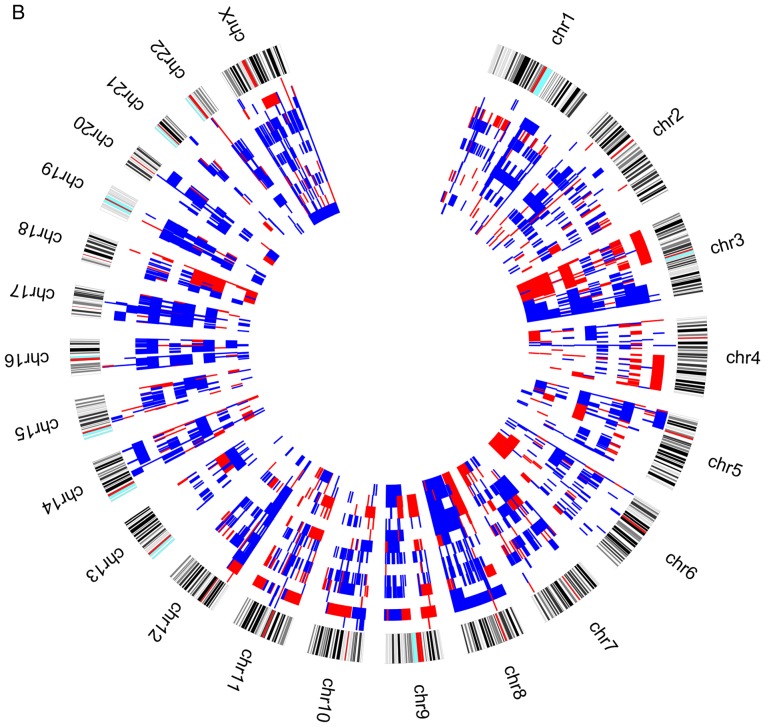
Figure 2.
Circos plot with genomic pattern identified by array-CGH technique for upper aerodigestive tract cancer patients (A) with relapses or metastasis. Blue color represents copy number gains and red copy number losses. Each layer represents a patient and the most outer layer represents the chromosomes. CGH, Comparative Genomic Hybridisation. Circos plot with genomic pattern identified by array-CGH technique for upper aerodigestive tract cancer patients (B) without relapses or metastasis. Blue color represents copy number gains and red copy number losses. Each layer represents a patient and the most outer layer represents the chromosomes. CGH, comparative genomic hybridisation.


