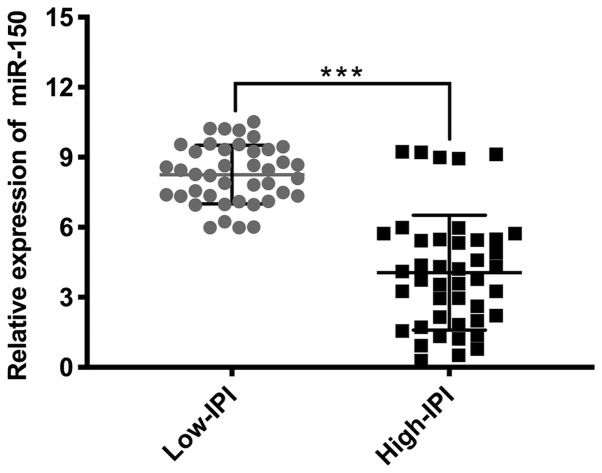
Figure 3.
miR-150 expression in the IPI subgroups. Reverse transcription-quantitative PCR analysis demonstrated that miR-150 expression was significantly lower in the high-IPI subgroup compared with the low-IPI subgroup. All results were normalized to the internal reference gene U6. ***P<0.001. miR, microRNA; IPI, International Prognostic Index.

