
Figure 2.
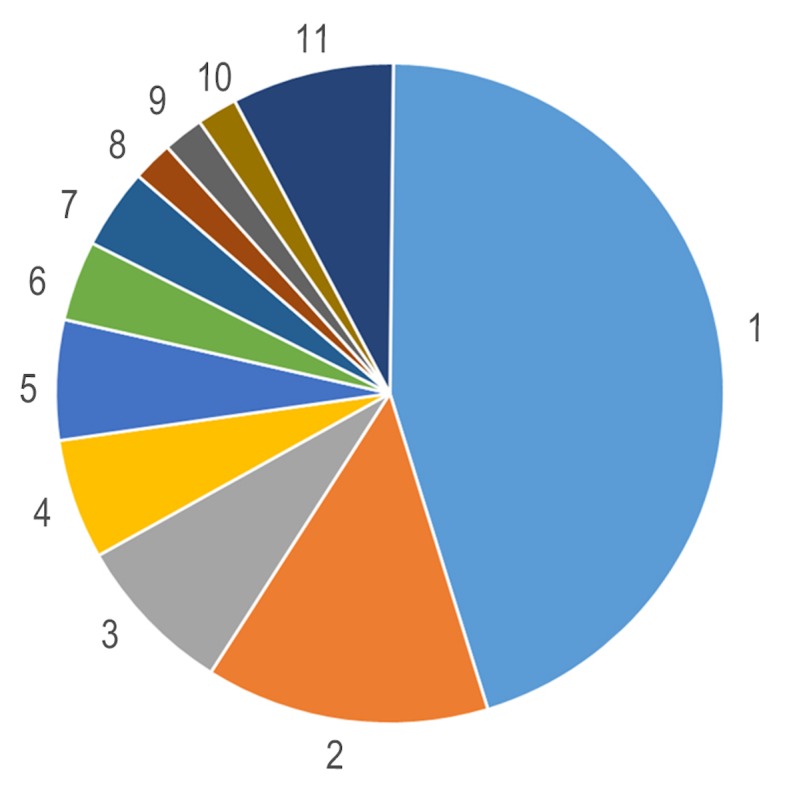
Human Metabolme Database compound classification analysis of the significantly altered metabolites indicating that lipids were the mo st influenced metabolite under simulated microgravity. 1, Glycerophospholipids (45.1%); 2, Fatty Acids (13.73%); 3, Carboxylic acids and derivatives (7.84%); 4, Prenol lipids (5.88%); 5, Sphingolipids (5.88%); 6, Organonitrogen Compounds (3.92%); 7, Organooxygen compounds (3.92%); 8, Alcohols and polyols (1.96%); 9, Carbonyl compounds (1.96%); 10, Flavonoids (1.96%) and 11, Others (7.85%).