Figure 5.

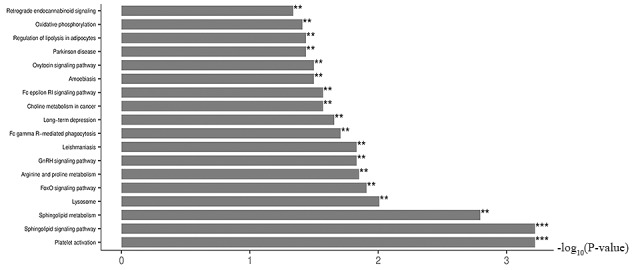
Kyoto Encyclopedia of Genes and Genomes pathway enrichment analysis of the significantly dysregulated metabolites with SMG. x-axis is the -log10(P-value). **P<0.01 and ***P<0.001. FoxO, forkhead box O.

Kyoto Encyclopedia of Genes and Genomes pathway enrichment analysis of the significantly dysregulated metabolites with SMG. x-axis is the -log10(P-value). **P<0.01 and ***P<0.001. FoxO, forkhead box O.