Figure 4.

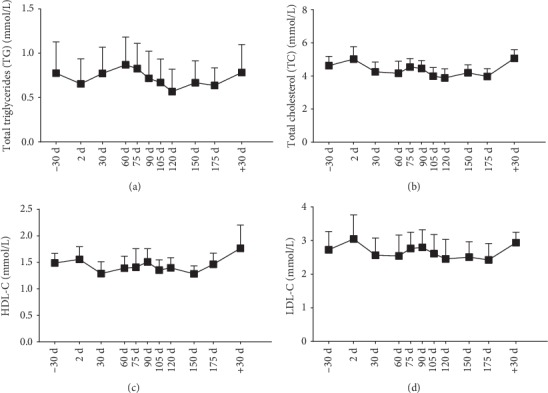
Blood lipid levels. (a) TG; (b) TC; (c) HDL-C; (d) LDL-C. Data are expressed as means ± SEM. Presentation of results for lipids with 8 time points has been permitted by Frontiers in Physiology.

Blood lipid levels. (a) TG; (b) TC; (c) HDL-C; (d) LDL-C. Data are expressed as means ± SEM. Presentation of results for lipids with 8 time points has been permitted by Frontiers in Physiology.