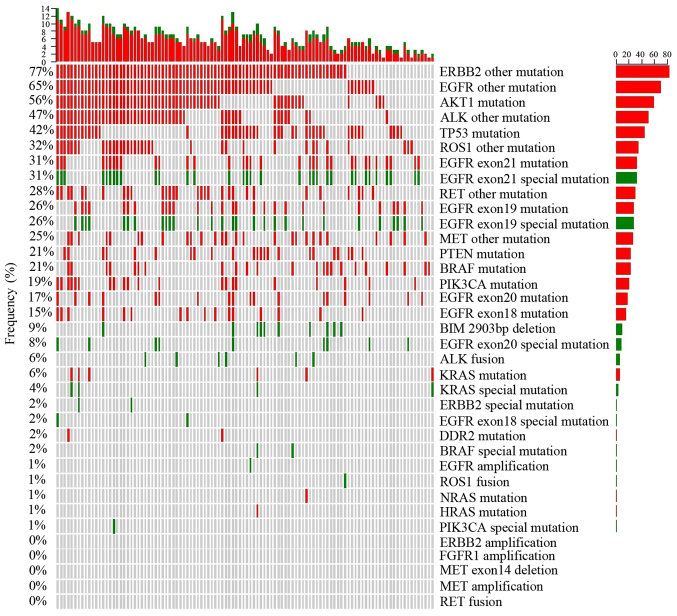
Figure 1.
Plot showing mutations related to certain agents and variants of unknown significance frequency with variant distribution in samples. The frequency of variant-positive samples per gene is shown on the left, and the number of different variants per sample is shown on the upper side. The right side shows the total number of variants per gene. Green indicates variants related to certain therapeutic agents, red indicates variants of unknown significance and gray indicates no variant was detected.

