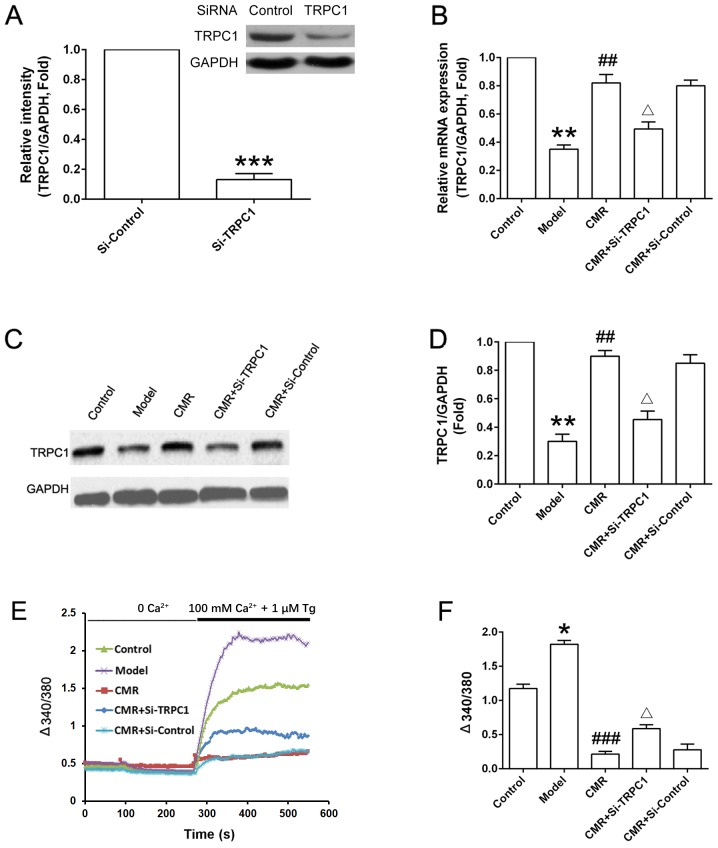
Figure 6.
Effect of CMR on the TRPC1/Ca2+ axis in the DRG neurons of diabetic rats. DRG neurons were seeded in a 6- well plate (5×10⁵ cells/well) and were cultured for 24 h. (A) Normal rats were treated with control siRNA and TRPC1 siRNA. DRG neurons were collected and TRPC1 expression was detected by western blotting and was statistically analyzed. (B) mRNA expression levels of TRPC1 in the DRG neurons from different groups were detected by reverse transcription- quantitative PCR and analyzed. (C) Protein expression levels of TRPC1 in the DRG neurons from different groups were detected by western blotting and (D) were statistically analyzed. GAPDH was used to confirm equal sample loading. (E) DRG neurons were seeded in a 6- well plate (5×10⁵ cells/well) and were cultured for 24 h. Cytosolic Ca2+ was measured in Fura- 2- loaded DRG neurons and (F) statistically analyzed (340/380). Representative traces of intracellular Ca2+ in DRG neurons are shown. *P<0.05, **P<0.01, ***P<0.001 vs. control; ##P<0.01 vs. model; ΔP<0.05 vs. CMR. CMR, Cortex Mori Radicis extract; TRPC1, transient receptor potential canonical channel 1; si-, small interfering RNA; DRG, dorsal root ganglia; Tg, thapsigargin.

