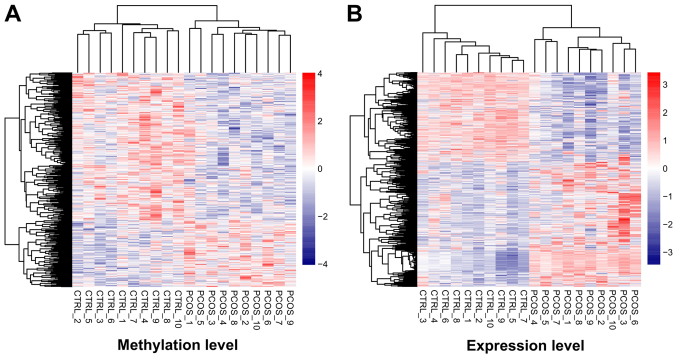
Figure 1.
Hierarchically clustering analysis of screened differentially methylated genes and differentially expressed genes. The contrasting colors indicate clear differences in methylation or expression levels between PCOS and healthy control samples. Heat-maps for the (A) differentially methylated and (B) differentially expressed genes are shown. PCOS, polycystic ovary syndrome.

